Inflation's Second Wave Is Here, And The Curve Is Still Flat
The question I kept returning to this year was what credit investors should do if a second wave of inflation arrived alongside a flat curve. It arrived. Headline inflation is back at 3.7%, the Federal Reserve has raised its policy rate, and credit spreads have started to widen. The...

What Credit Is Really Watching (JOJO)
KEY HIGHLIGHTS
- U.S. headline Consumer Price Index (CPI) was 3.7% year over year in September 2026, up from 3.4% in August. Core CPI was 2.6%.[1]
- The Federal Reserve’s policy rate was 4.00% as of 9/16/2026, up from 3.75%.[2]
- The 10-year breakeven inflation rate was 2.34% on 10/23/2026, and the 10-year minus 2-year Treasury spread was +0.31% on the same date.[3][4]
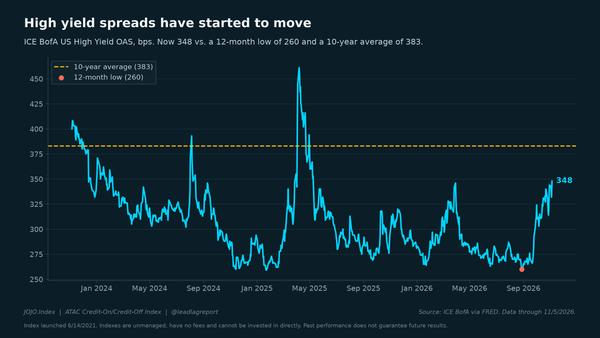
- The ICE BofA US High Yield Index Option-Adjusted Spread (OAS) was 3.40% on 10/22/2026, up from 2.66% on 9/21/2026.[5]
- The 30-day SEC yield* on The ATAC Credit Rotation ETF (Ticker: JOJO) was 5.76% as of 9/30/2026.[6]
The question I kept returning to this year was what credit investors should do if a second wave of inflation arrived alongside a flat curve. It arrived. Headline inflation is back at 3.7%, the Federal Reserve has raised its policy rate, and credit spreads have started to widen. The question now is not whether inflation will surprise. It is what credit does when inflation stays where it is and the curve stays where it is.
THE SECOND WAVE
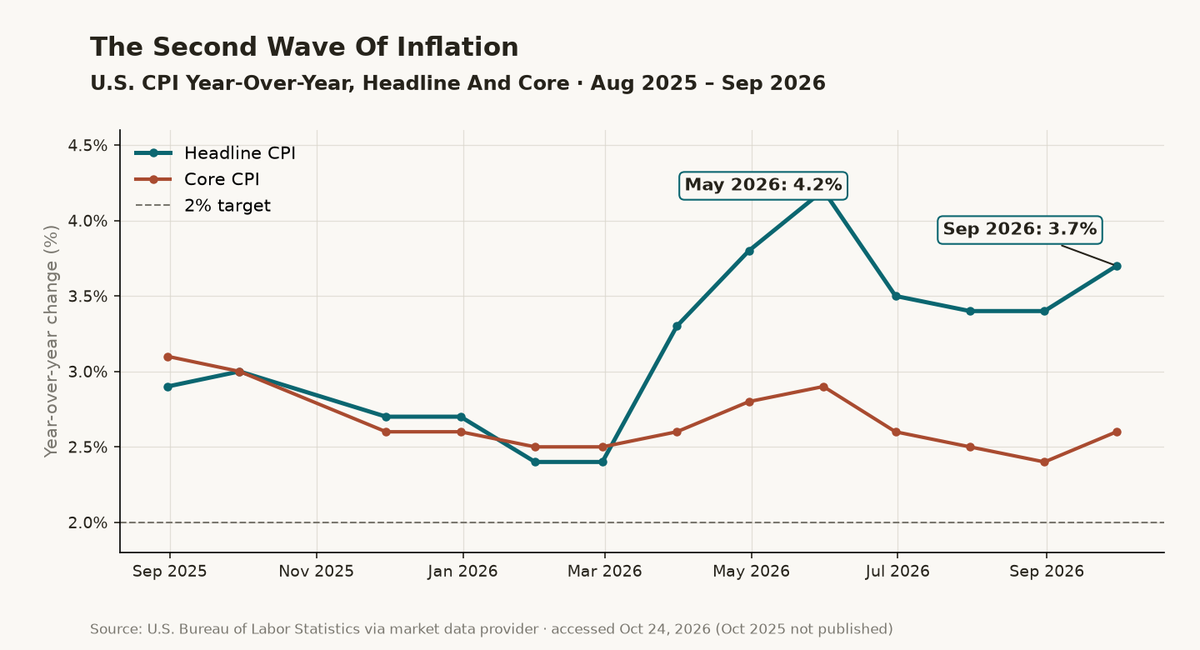
Headline CPI was 2.4% in January and February 2026.[1] It reached 4.2% in May, eased to 3.4% in July and August, and rose again to 3.7% in September, with a 0.6% monthly gain.[1] Core CPI, which excludes food and energy, was 2.6% in September, up from 2.4% in August.[1]
Most of the gap between headline and core is energy, which was up 20.4% year over year in September.[1] Energy-led inflation raises the cost of living quickly, but it can also fade quickly. That is the uncertainty policymakers are working through, and it is why the bond market is not settled.
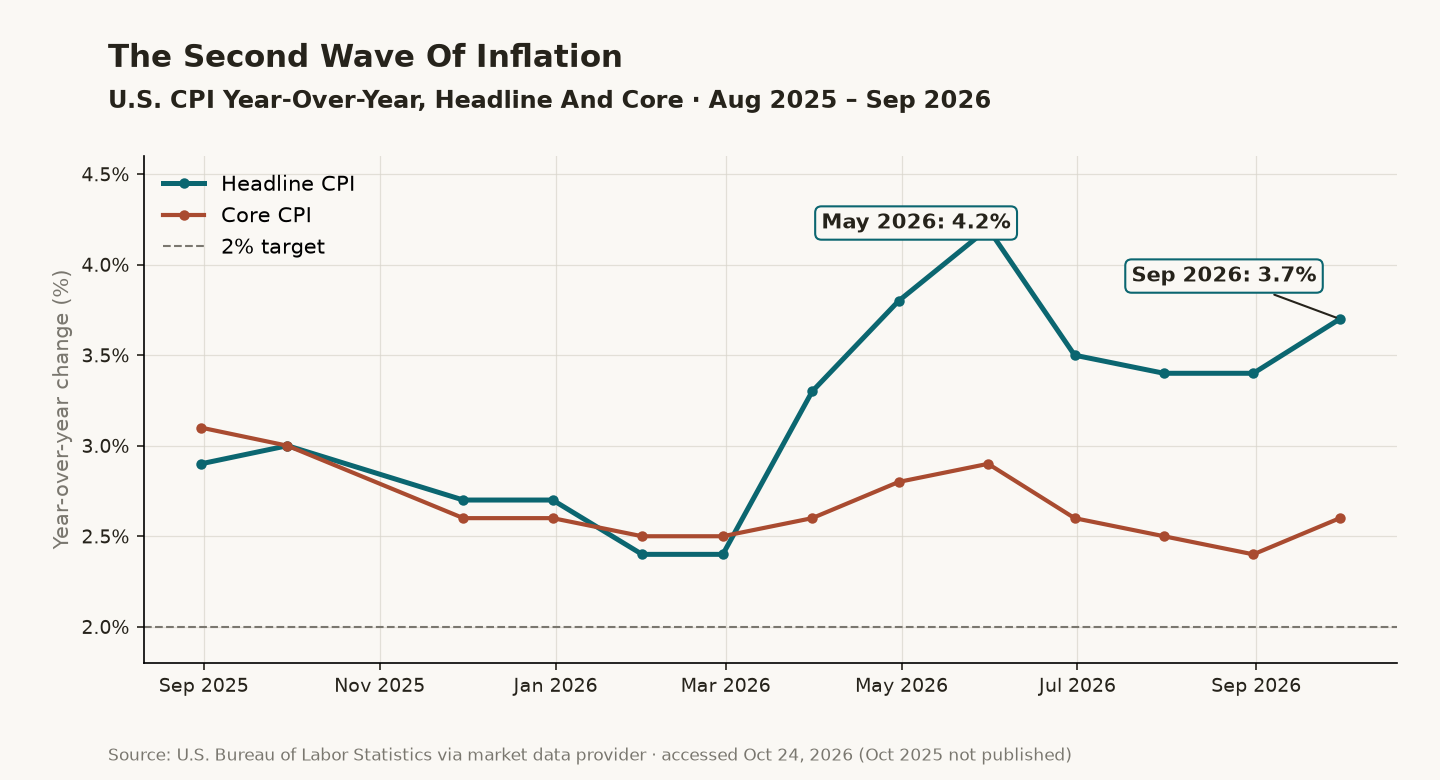
Chart 1: U.S. CPI year over year, headline and core, August 2025 to September 2026. Data as of: 9/30/2026
THE FED MOVED
On 9/16/2026, the Federal Reserve’s policy rate rose to 4.00% from 3.75%.[2] For credit investors, that matters in two ways. It raises the funding cost for lower-quality borrowers, and it lifts the hurdle that Treasuries set for riskier bonds.
The ICE BofA US High Yield Index OAS widened from 2.66% on 9/21/2026 to 3.40% on 10/22/2026, a 0.74 percentage point move in a month.[5] I do not argue that the rate move caused the widening, but the timing fits the idea that credit began to price a tighter policy path.
A CURVE THAT KEEPS REFUSING TO DECIDE
The 10-year minus 2-year spread was +0.31% on 10/23/2026.[4] That is positive but narrow, and the path to get there has been bumpy: +0.20% on 9/21/2026, up to +0.51% on 10/7/2026, then back down.[4] A curve that moves that much in a month without resolving is not potentially telling you the economy is in good shape or bad shape. It may be telling you that the market does not know.
For credit, a flat but positive curve is not automatically bearish. It becomes more concerning when it flattens because growth expectations are falling while funding costs are rising. Unemployment rose to 4.2% in September from 4.1%, which is a small move but in the direction that would matter.[7]
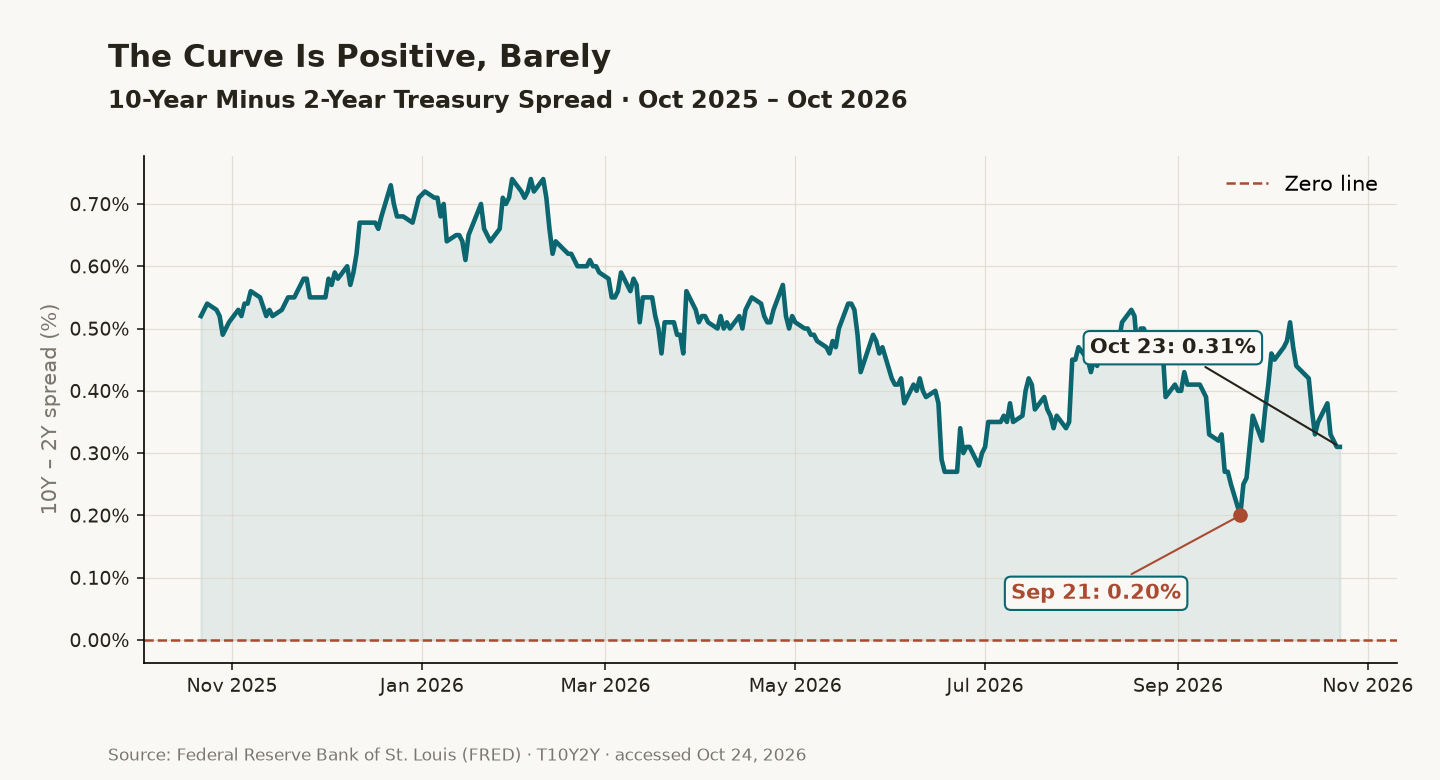
Chart 2: The 10-year minus 2-year Treasury spread, October 2025 to October 2026. Data as of: 10/23/2026
EXPECTATIONS HAVE MOVED, BUT NOT MUCH
The 10-year breakeven inflation rate was 2.34% on 10/23/2026, up from 2.25% on 7/7/2026.[3] Compared with a realized 3.7% headline inflation rate, that is a small adjustment. The bond market is still betting that the inflation spike fades.
That bet may be right, and I would not argue against it. But a market that believes inflation will fade and a Fed that raised rates anyway are not in agreement. Credit sits in the middle of that disagreement, and it has already started to move.
WHERE JOJO FITS
The ATAC Credit Rotation ETF (Ticker: JOJO) is a rules-based fund that seeks to rotate between higher-risk and lower-risk fixed income exposures based on intermarket signals. One of the relationships the methodology emphasizes is Utilities relative to the broader S&P 500. Utilities are typically treated as bond proxies, so when they begin to outperform the market, it possibly reflects a rotation toward defense.
On that measure, State Street Utilities Select Sector SPDR ETF (XLU) has outperformed State Street SPDR S&P 500 ETF Trust (SPY) by about 9% since its relative low on 9/25/2026, although it remains below where it started in July on a relative basis.[8] That is a recent and partial recovery. The framework does not require me to forecast inflation or the Fed. It requires a defined way to respond when the pattern of relative leadership changes.
The 30-day SEC yield on JOJO was 5.76% as of 9/30/2026.[6] A standardized yield measures income earned over 30 days after expenses. It is not a forecast of future income or a measure of total return, and fund prices can decline by more than the yield provides, particularly when interest rates rise. Investors should read the Fund’s most recent yield and prospectus for the full picture.
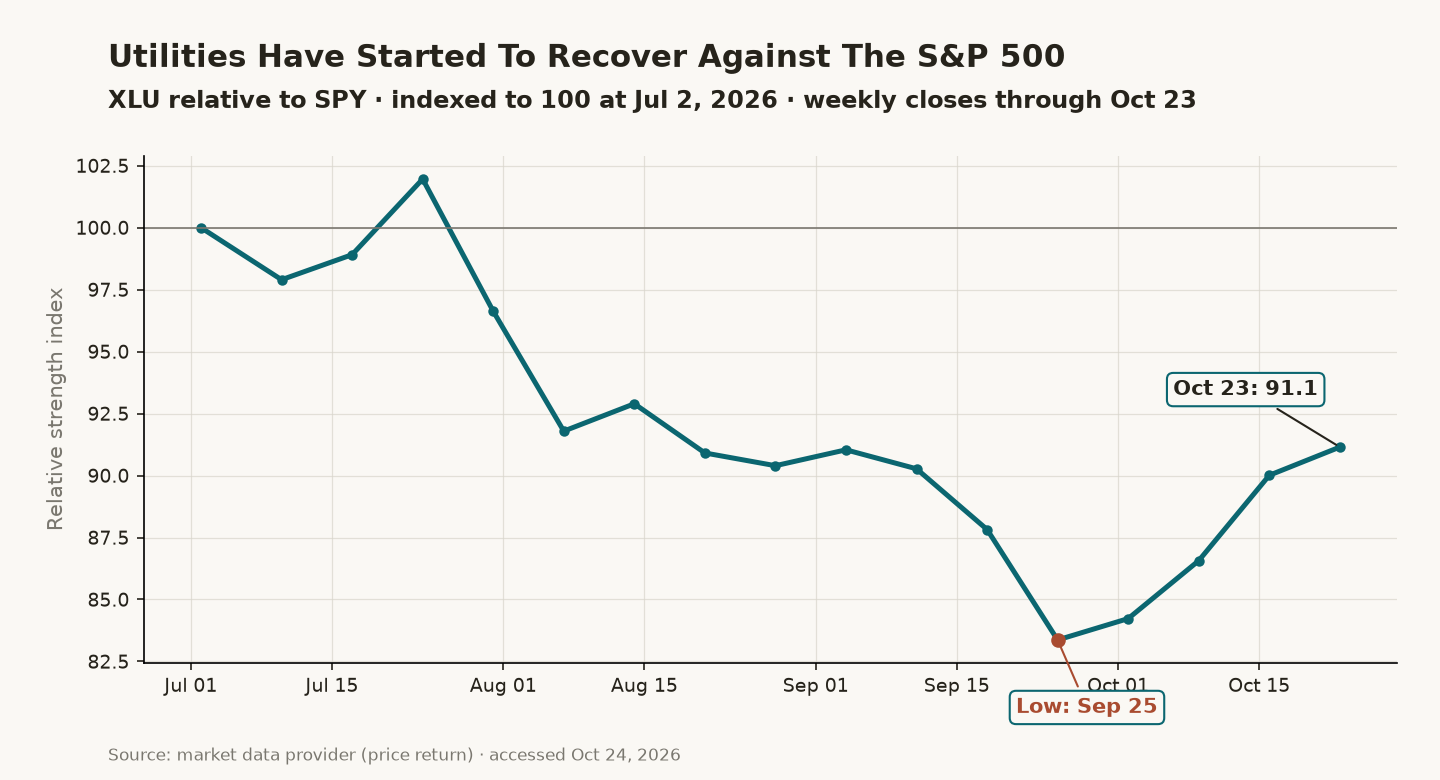
Chart 3: XLU relative to SPY, indexed to 100 at 7/2/2026. Data as of: 10/23/2026
WHAT I AM WATCHING FROM HERE
First, the next CPI print. If headline inflation stays near 3.7% while core rises from 2.6%, a second wave stops looking like an energy story and starts looking like a broad one.
Second, the Fed’s next step, and whether the market reads it as the end of tightening or the start of more. Breakevens at 2.34% leave room for a surprise in either direction.
Third, whether the curve resolves. A move toward inversion would suggest the market is pricing growth stress. A steady steepening would suggest credit conditions are stabilizing.
CONCLUSION
Sticky inflation, a flat curve and widening credit spreads are no longer a hypothetical set of risks. They are the market’s current state. That does not tell us what happens next. It does say that the value of a disciplined rotation process is easier to see now than it was in July.
The ATAC Credit Rotation ETF (Ticker: JOJO) is built to respond to changes in intermarket leadership, not to predict the trigger. In a market where inflation is back and credit is repricing, that responsiveness is the point.
Michael A. Gayed, CFA
ENDNOTES
[1] U.S. Bureau of Labor Statistics, Consumer Price Index, September 2026 reference month, accessed 10/24/2026 via market data provider: headline CPI 3.7% year over year (3.4% in August), core CPI 2.6% (2.4% in August), headline 0.6% month over month, energy 20.4% year over year, https://www.bls.gov/cpi/
[2] Federal Reserve, policy rate 4.00% as of 9/16/2026, up from 3.75%, accessed 10/24/2026 via market data provider, https://www.federalreserve.gov/monetarypolicy/openmarket.htm
[3] Federal Reserve Bank of St. Louis, “10-Year Breakeven Inflation Rate (T10YIE),” FRED, accessed 10/24/2026 (latest observation 10/23/2026), https://fred.stlouisfed.org/series/T10YIE
[4] Federal Reserve Bank of St. Louis, “10-Year Treasury Constant Maturity Minus 2-Year Treasury Constant Maturity (T10Y2Y),” FRED, accessed 10/24/2026 (latest observation 10/23/2026), https://fred.stlouisfed.org/series/T10Y2Y
[5] Federal Reserve Bank of St. Louis, “ICE BofA US High Yield Index Option-Adjusted Spread (BAMLH0A0HYM2),” FRED, accessed 10/24/2026 (latest observation 10/22/2026), https://fred.stlouisfed.org/series/BAMLH0A0HYM2
[6] ATAC Funds, “ATAC Credit Rotation ETF (JOJO),” accessed 10/24/2026: 30-day SEC yield 5.76% as of 9/30/2026; fund holdings as of 10/24/2026, https://atacfunds.com/jojo/
[7] U.S. Bureau of Labor Statistics, unemployment rate 4.2% for September 2026 (4.1% in August), accessed 10/24/2026 via market data provider, https://www.bls.gov/news.release/empsit.nr0.htm
[8] Closing prices for SPY and XLU (State Street) and HYG, LQD and TLT (iShares), 7/2/2026 through 10/23/2026, accessed 10/24/2026 via market data provider. Price return only; excludes distributions. https://www.ssga.com/us/en/intermediary/etfs and https://www.ishares.com/us
DISCLOSURES (JOJO)
The ATAC Credit Rotation ETF (Ticker: JOJO) is distributed by Foreside Fund Services, LLC.
*The 30-day SEC yield on The ATAC Credit Rotation ETF (JOJO) was 5.76% as of 9/30/2026. Current 30-day SEC yield may be higher or lower and can be found at https://atacfunds.com/jojo/. The 30-day SEC yield reflects the dividends and interest earned during the period, after the deduction of the Fund’s expenses, and is a standardized measure of yield. The standardized 30-day SEC yield formula does not reflect any fee waivers or reimbursements in effect.
Junk debt, also known as high-yield bonds or speculative-grade debt, refers to fixed-income securities issued by companies or governments with lower credit ratings, offering higher interest rates to compensate investors for the elevated risk of default.
The ICE BofA US High Yield Index Option-Adjusted Spread measures the yield differential between US corporate high-yield bonds and a spot Treasury curve, quantifying the risk premium for below-investment-grade debt in the US market.
The Consumer Price Index measures the average change over time in the prices paid by urban consumers for a market basket of consumer goods and services. CPI is a lagging indicator and does not necessarily reflect current or forward inflation dynamics.
The 10-year breakeven inflation rate reflects a market-based measure of expected inflation derived from the difference between nominal Treasury yields and Treasury Inflation-Protected Securities yields. This measure reflects market participants’ expectations at a given moment in time and can move quickly.
The 10-year minus 2-year Treasury spread is the difference between the yield on the 10-year Treasury note and the yield on the 2-year Treasury note. A positive value indicates an upward-sloping yield curve; a negative value indicates an inverted curve.
ETF price changes cited in this article are price returns for the periods stated, exclude distributions, and are not the performance of any fund managed by the author or ATAC Funds.
Because the Fund is an actively managed ETF, the Fund’s performance will reflect the ability of the Fund’s investment adviser and sub-adviser to make investment decisions that are suited to achieving the Fund’s investment objective. Because the Fund may hold non-diversified positions, its performance may be more volatile than a diversified fund.
Because the Fund expects to change its exposure as frequently as each week based on short-term price performance information, changes to the Fund’s exposure may lag a significant change in an asset’s direction (up or down) if such changes first take effect at or near a weekend. Such lags between an asset’s performance and changes to the Fund’s exposure may result in significant underperformance relative to the broader equity or fixed income market.
The prices of fixed income securities may be affected by changes in interest rates, the creditworthiness and financial strength of the issuer and other factors. An increase in prevailing interest rates typically causes the value of existing fixed income securities to fall and often has a greater impact on longer duration and/or higher quality fixed income securities.
Past performance is no guarantee of future results.
The Fund’s investment objectives, risks, charges, expenses and other information are described in the statutory or summary prospectus, which must be read and considered carefully before investing. You may download the statutory or summary prospectus or obtain a hard copy by visiting https://atacfunds.com/jojo/. Please read the Prospectuses carefully before you invest.
Investing involves risk including the possible loss of principal.
Fund Risks: An investment in the Fund is subject to numerous risks including the possible loss of principal. There can be no assurance that the Fund will achieve its investment objective. Equity securities, such as common stocks, are subject to market, economic and business risks that may cause their prices to fluctuate. As with all ETFs, Fund shares may be bought and sold in the secondary market at market prices. The market price normally should approximate the Fund’s net asset value per share (NAV), but the market price sometimes may be higher or lower than the NAV. The Fund is new with a limited operating history. There are a limited number of financial institutions authorized to buy and sell shares directly with the Fund, and there may be a limited number of other liquidity providers in the marketplace. There is no assurance that Fund shares will trade at any volume, or at all, on any stock exchange. Low trading activity may result in shares trading at a material discount to NAV. Please see the prospectus and summary prospectus for a complete description of principal risks.
Debt securities are subject to the risk of an issuer’s (or other party’s) failure or inability to meet its obligations under the security. Multiple parties may have obligations under a debt security. An issuer or borrower may fail to pay principal and interest when due. The prices of fixed income securities may be affected by changes in interest rates, the creditworthiness and financial strength of the issuer and other factors. An increase in prevailing interest rates typically causes the value of existing fixed income securities to fall and often has a greater impact on longer duration and/or higher quality fixed income securities.
The Fund’s investments will be concentrated in an industry or group of industries to the extent the portfolio manager deems it appropriate to be so concentrated. In such event, the value of Shares may rise and fall more than the value of shares that invest in securities of companies in a broader range of industries. Investments in securities or other instruments of foreign securities involve certain risks not involved in domestic investments and may experience more rapid and extreme changes in value than investments in securities of U.S. companies.
The fund is distributed by Foreside Fund Services, LLC.
Learn more about JOJO at https://atacfunds.com/jojo/ Lead-Lag Publishing, LLC is not an affiliate of Tidal or Foreside Fund Services, LLC.
The Lead-Lag Report is provided by Lead-Lag Publishing, LLC. All opinions and views mentioned in this report constitute our judgments as of the date of writing and are subject to change at any time. Information within this material is not intended to be used as a primary basis for investment decisions and should also not be construed as advice meeting the particular investment needs of any individual investor. Trading signals produced by the Lead-Lag Report are independent of other services provided by Lead-Lag Publishing, LLC or its affiliates, and positioning of accounts under their management may differ. Please remember that investing involves risk, including loss of principal, and past performance may not be indicative of future results. Lead-Lag Publishing, LLC, its members, officers, directors and employees expressly disclaim all liability in respect to actions taken based on any or all of the information on this writing.