The Credit Signal: High Yield Spreads Hit a 12-Month High in Week Three of Credit-Off
Weekly read on the JOJO.Index credit signal: credit-off for a third week, utilities up 10.28% vs. the S&P 500 in four weeks, and high yield spreads at a 12-month high of 348 bps.

The Credit Signal is a weekly read on one question: is the equity market telling credit to get defensive? Data through Friday, 11/6/2026.
The signal this week: credit-off, week three
No flip. The JOJO.Index stayed credit-off, in long Treasuries, for a third straight week. It moved there in the week ending Oct 23.
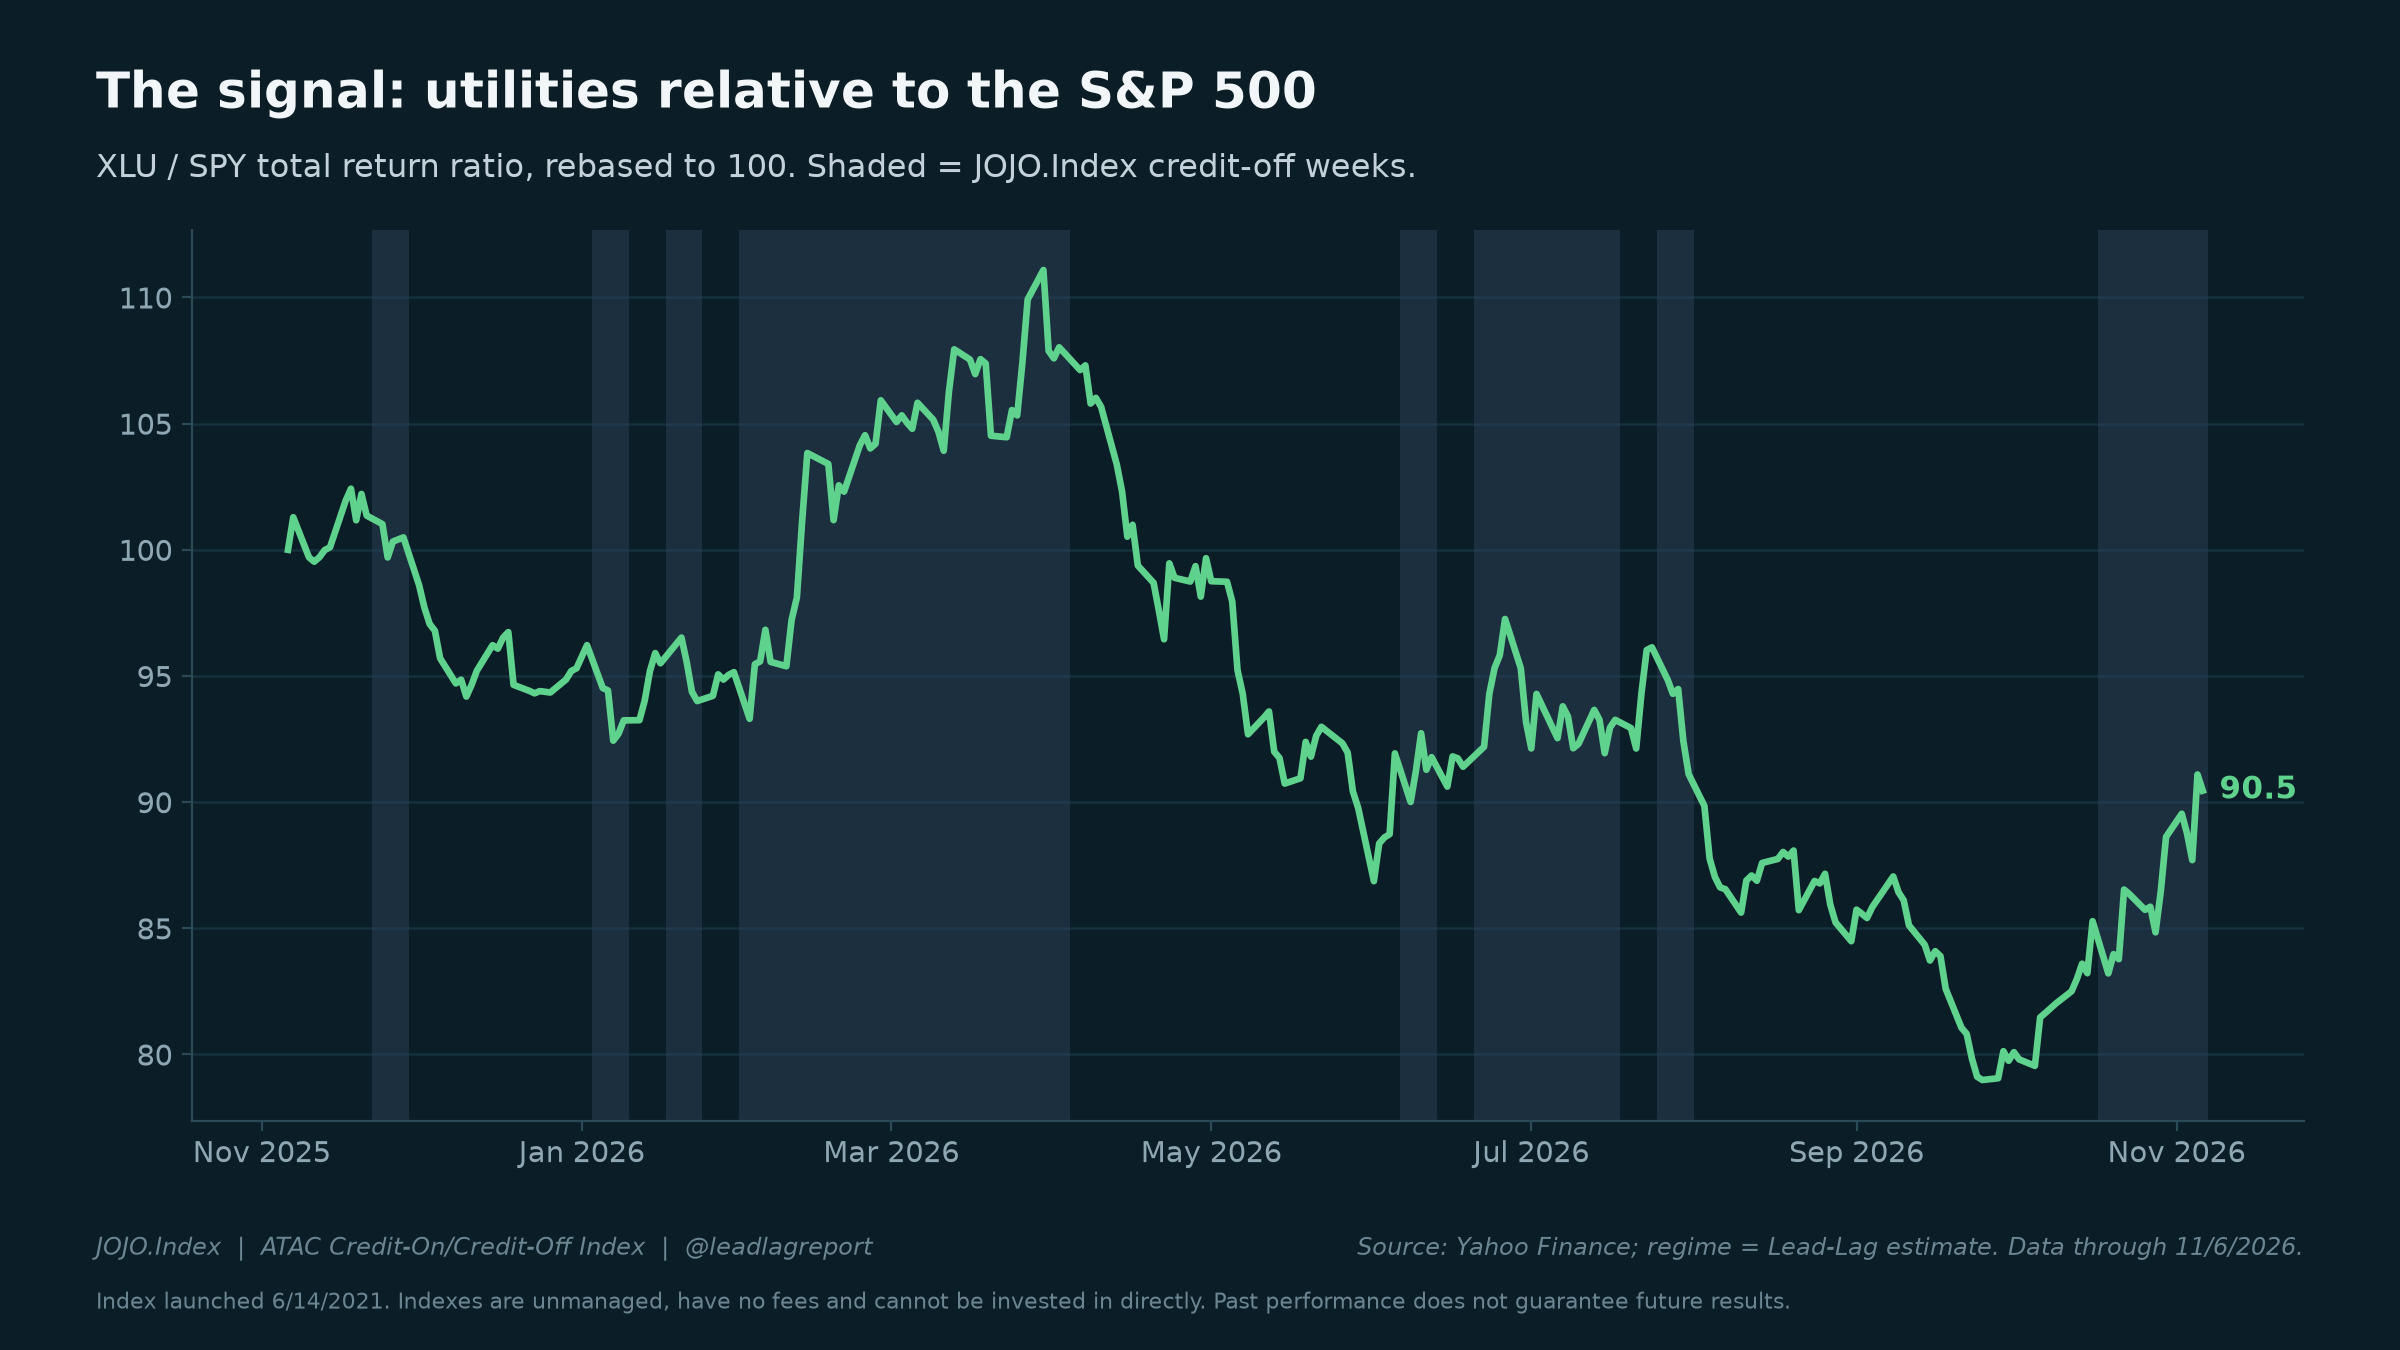
Utilities are still doing the talking. Over four weeks they gained 10.28% against the S&P 500, and over 13 weeks they are now ahead by 5.64%. Last week the S&P 500 fell 2.7%.
I have always believed utilities lead. When they lead for this long, the signal stays defensive. That is a read on what the equity market is doing now, not a call on what comes next.
What credit spreads are doing
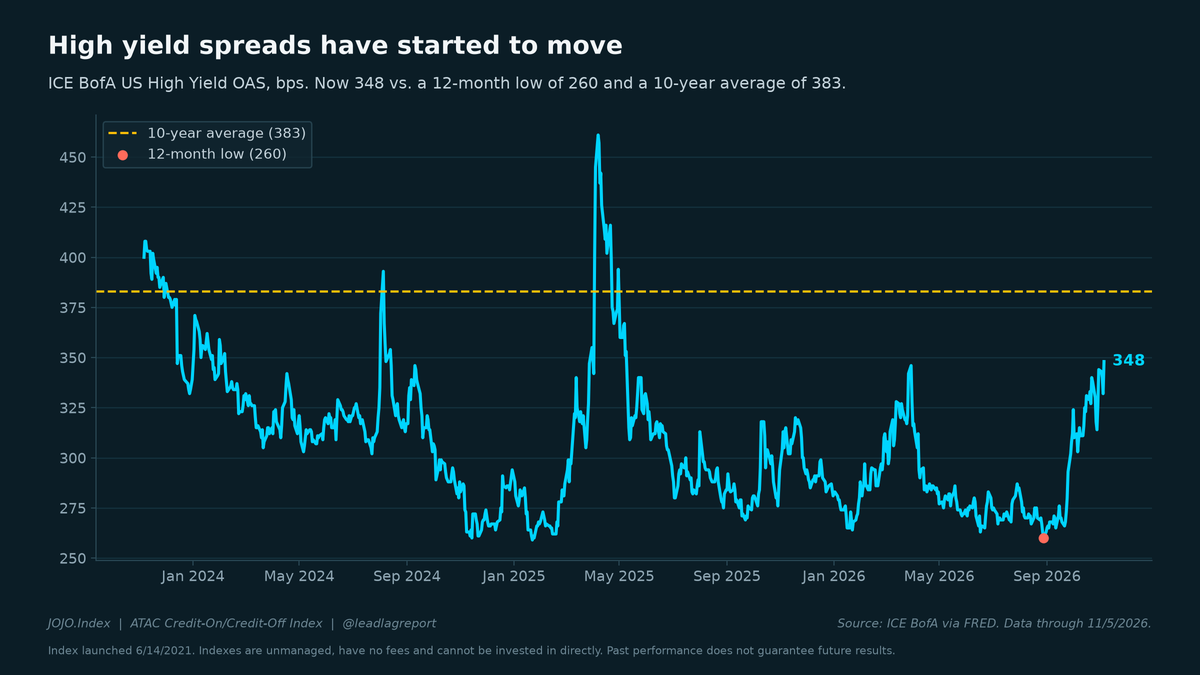
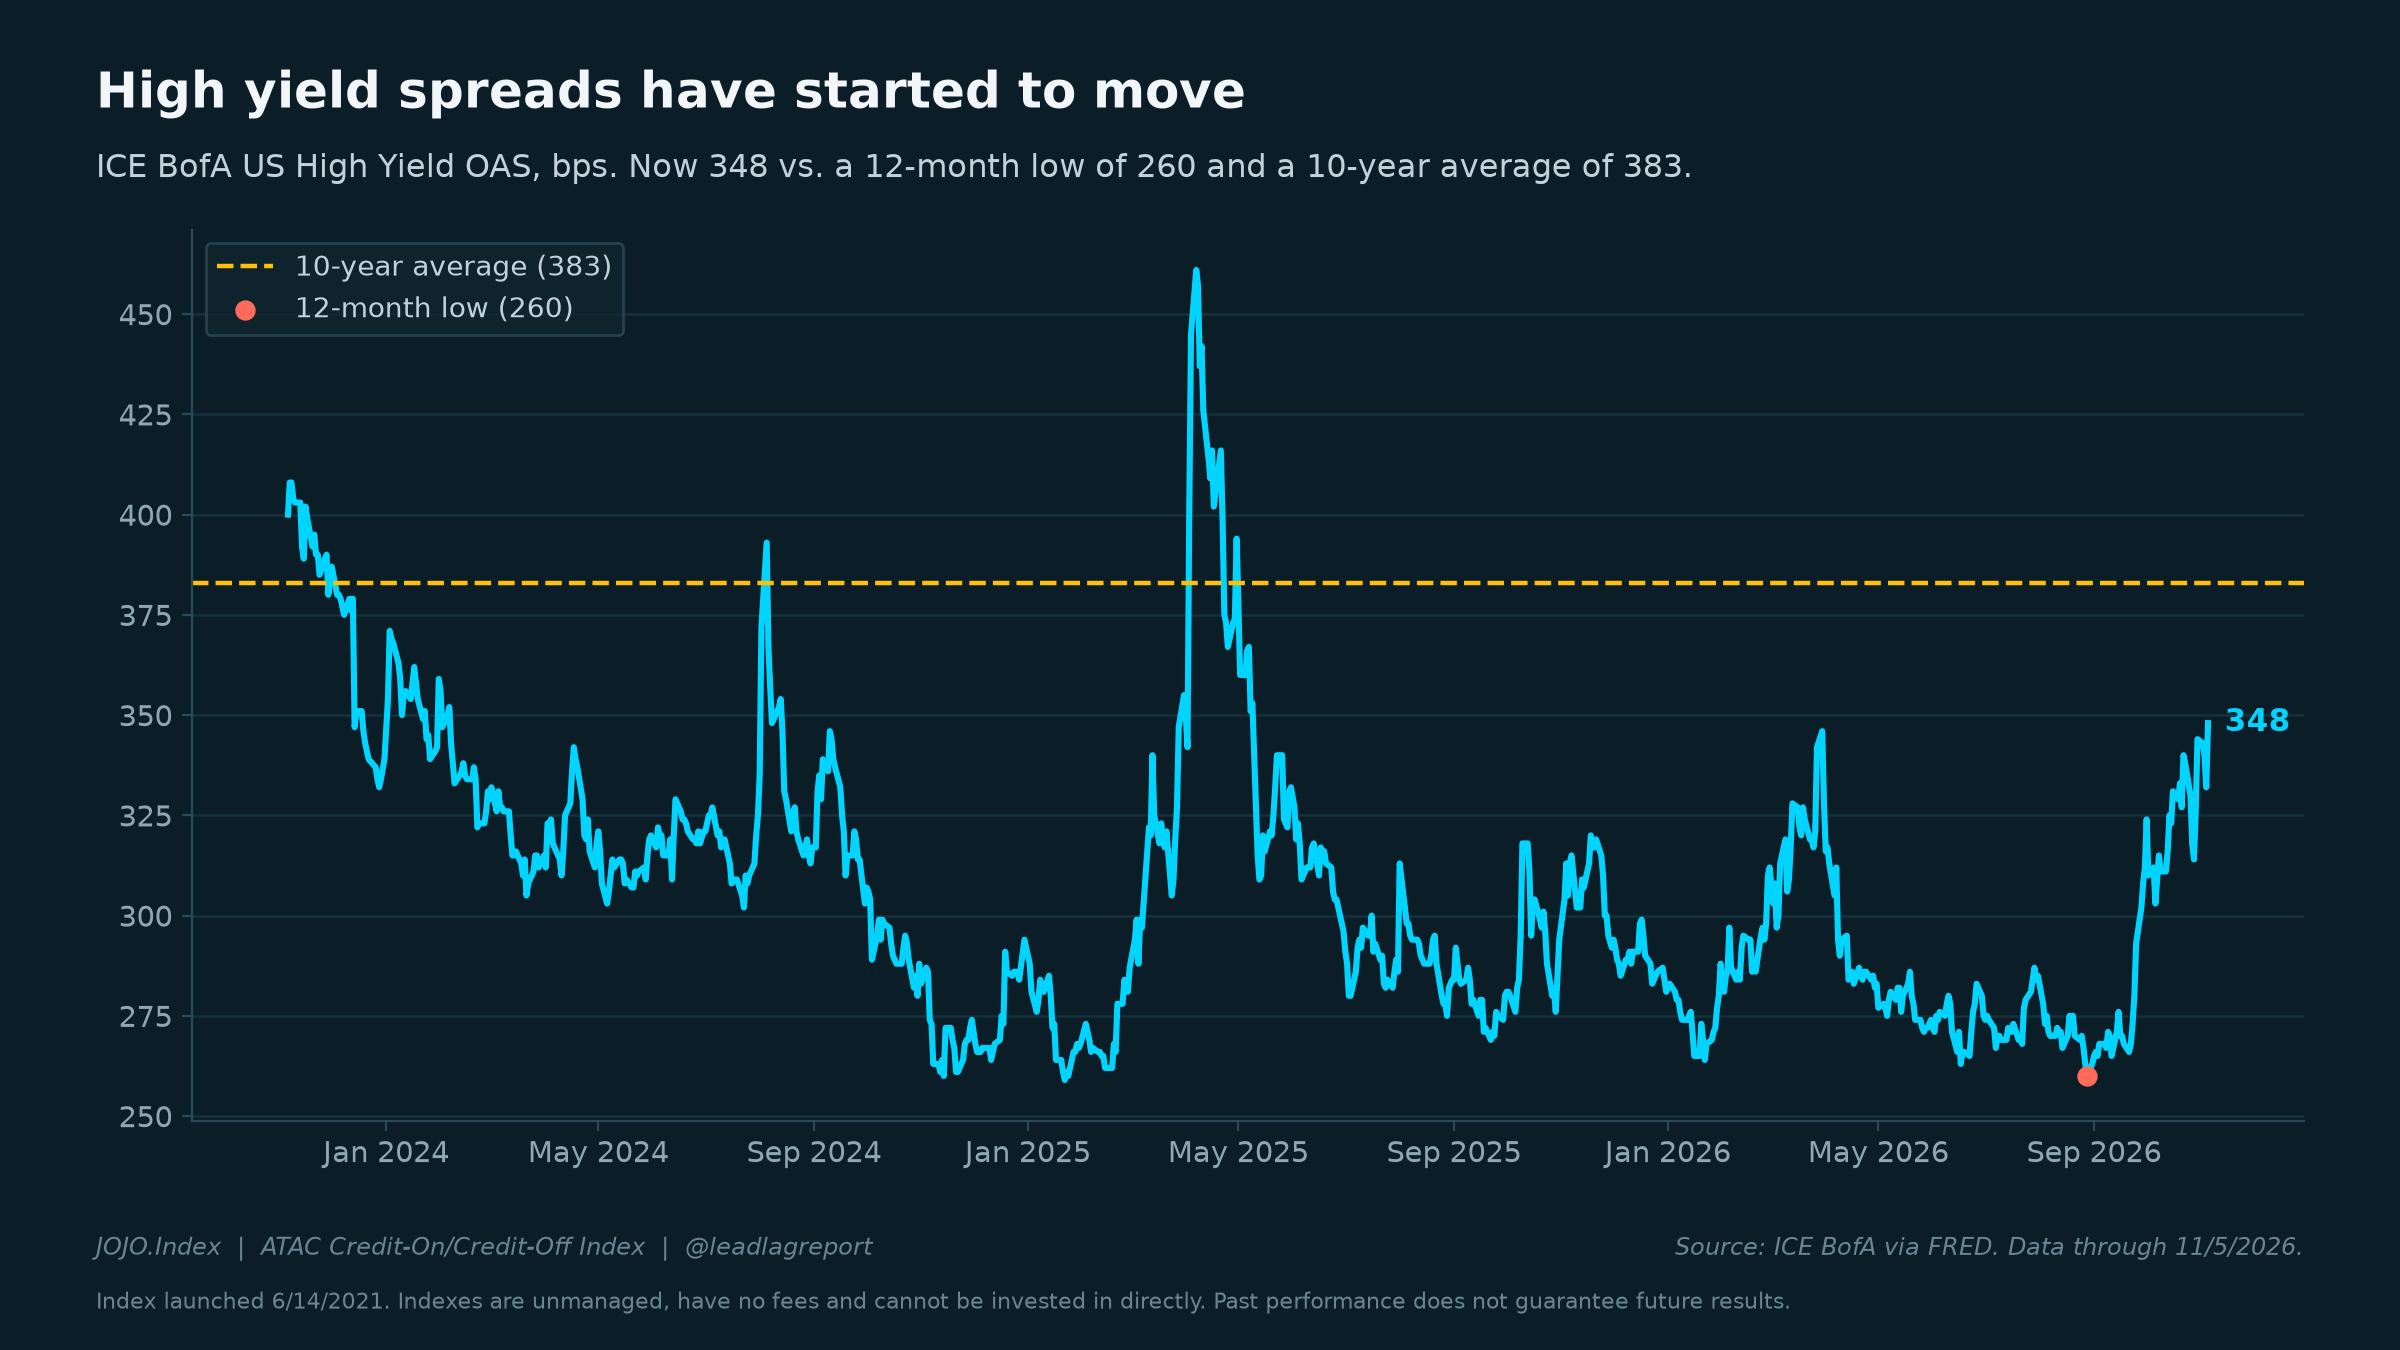
This is the headline. High yield spreads were 348 bps on 11/5, a new 12-month high. That is 88 bps above the 12-month low of 260 on Aug 28. They were 326 on 10/29.
Context matters. 348 bps is still below the 10-year average of 383, and 26.1% of daily readings in the full ICE BofA history on FRED have been tighter. Investment grade is at 93 bps vs. a 10-year average of 114. Spreads are repricing. They are not yet stressed.
From the crisis file (backtested): the 2013 taper tantrum, a miss
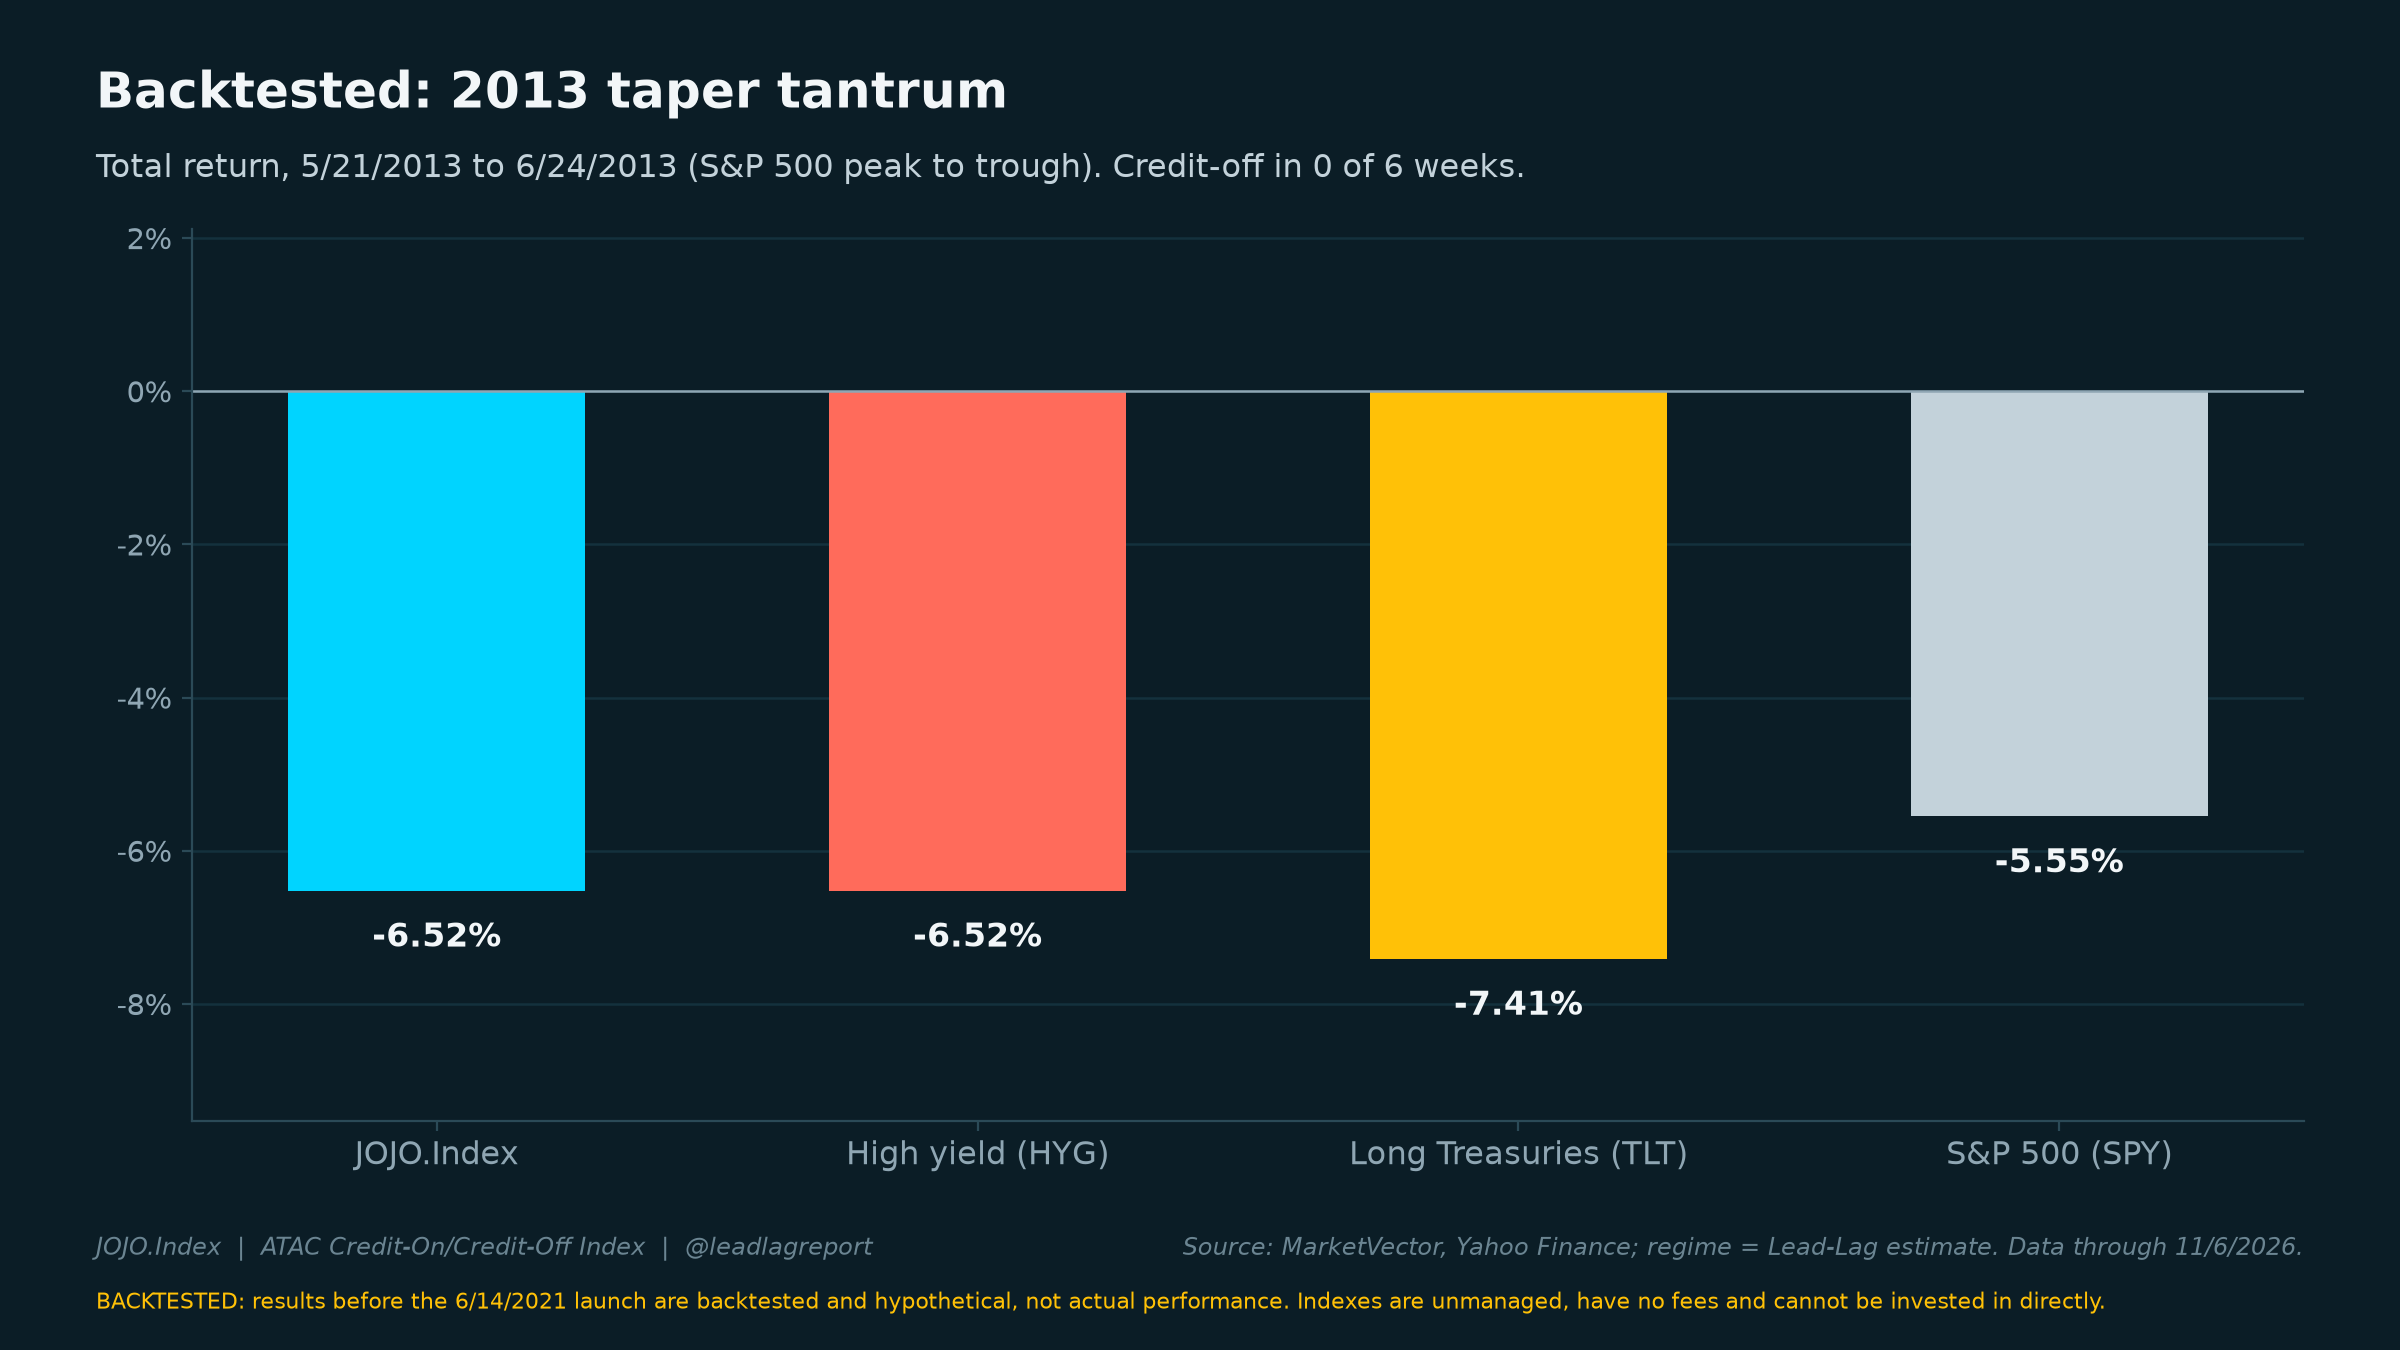
Backtested, 5/21/2013 to 6/24/2013, S&P 500 peak to trough. The S&P 500 fell 5.55%. High yield fell 6.52%. The JOJO.Index also fell 6.52%. It was credit-off in 0 of 6 weeks.
Why it missed: this was a rate shock, not a credit scare. Long Treasuries fell 7.41%, more than high yield, so the defensive sleeve offered no shelter. The move was also fast. These results are backtested and hypothetical; the index launched 6/14/2021.
That is the lesson I keep in mind today. The signal works best when stress builds in credit over weeks. When rates are the problem, both sleeves can fall together.
The live scorecard
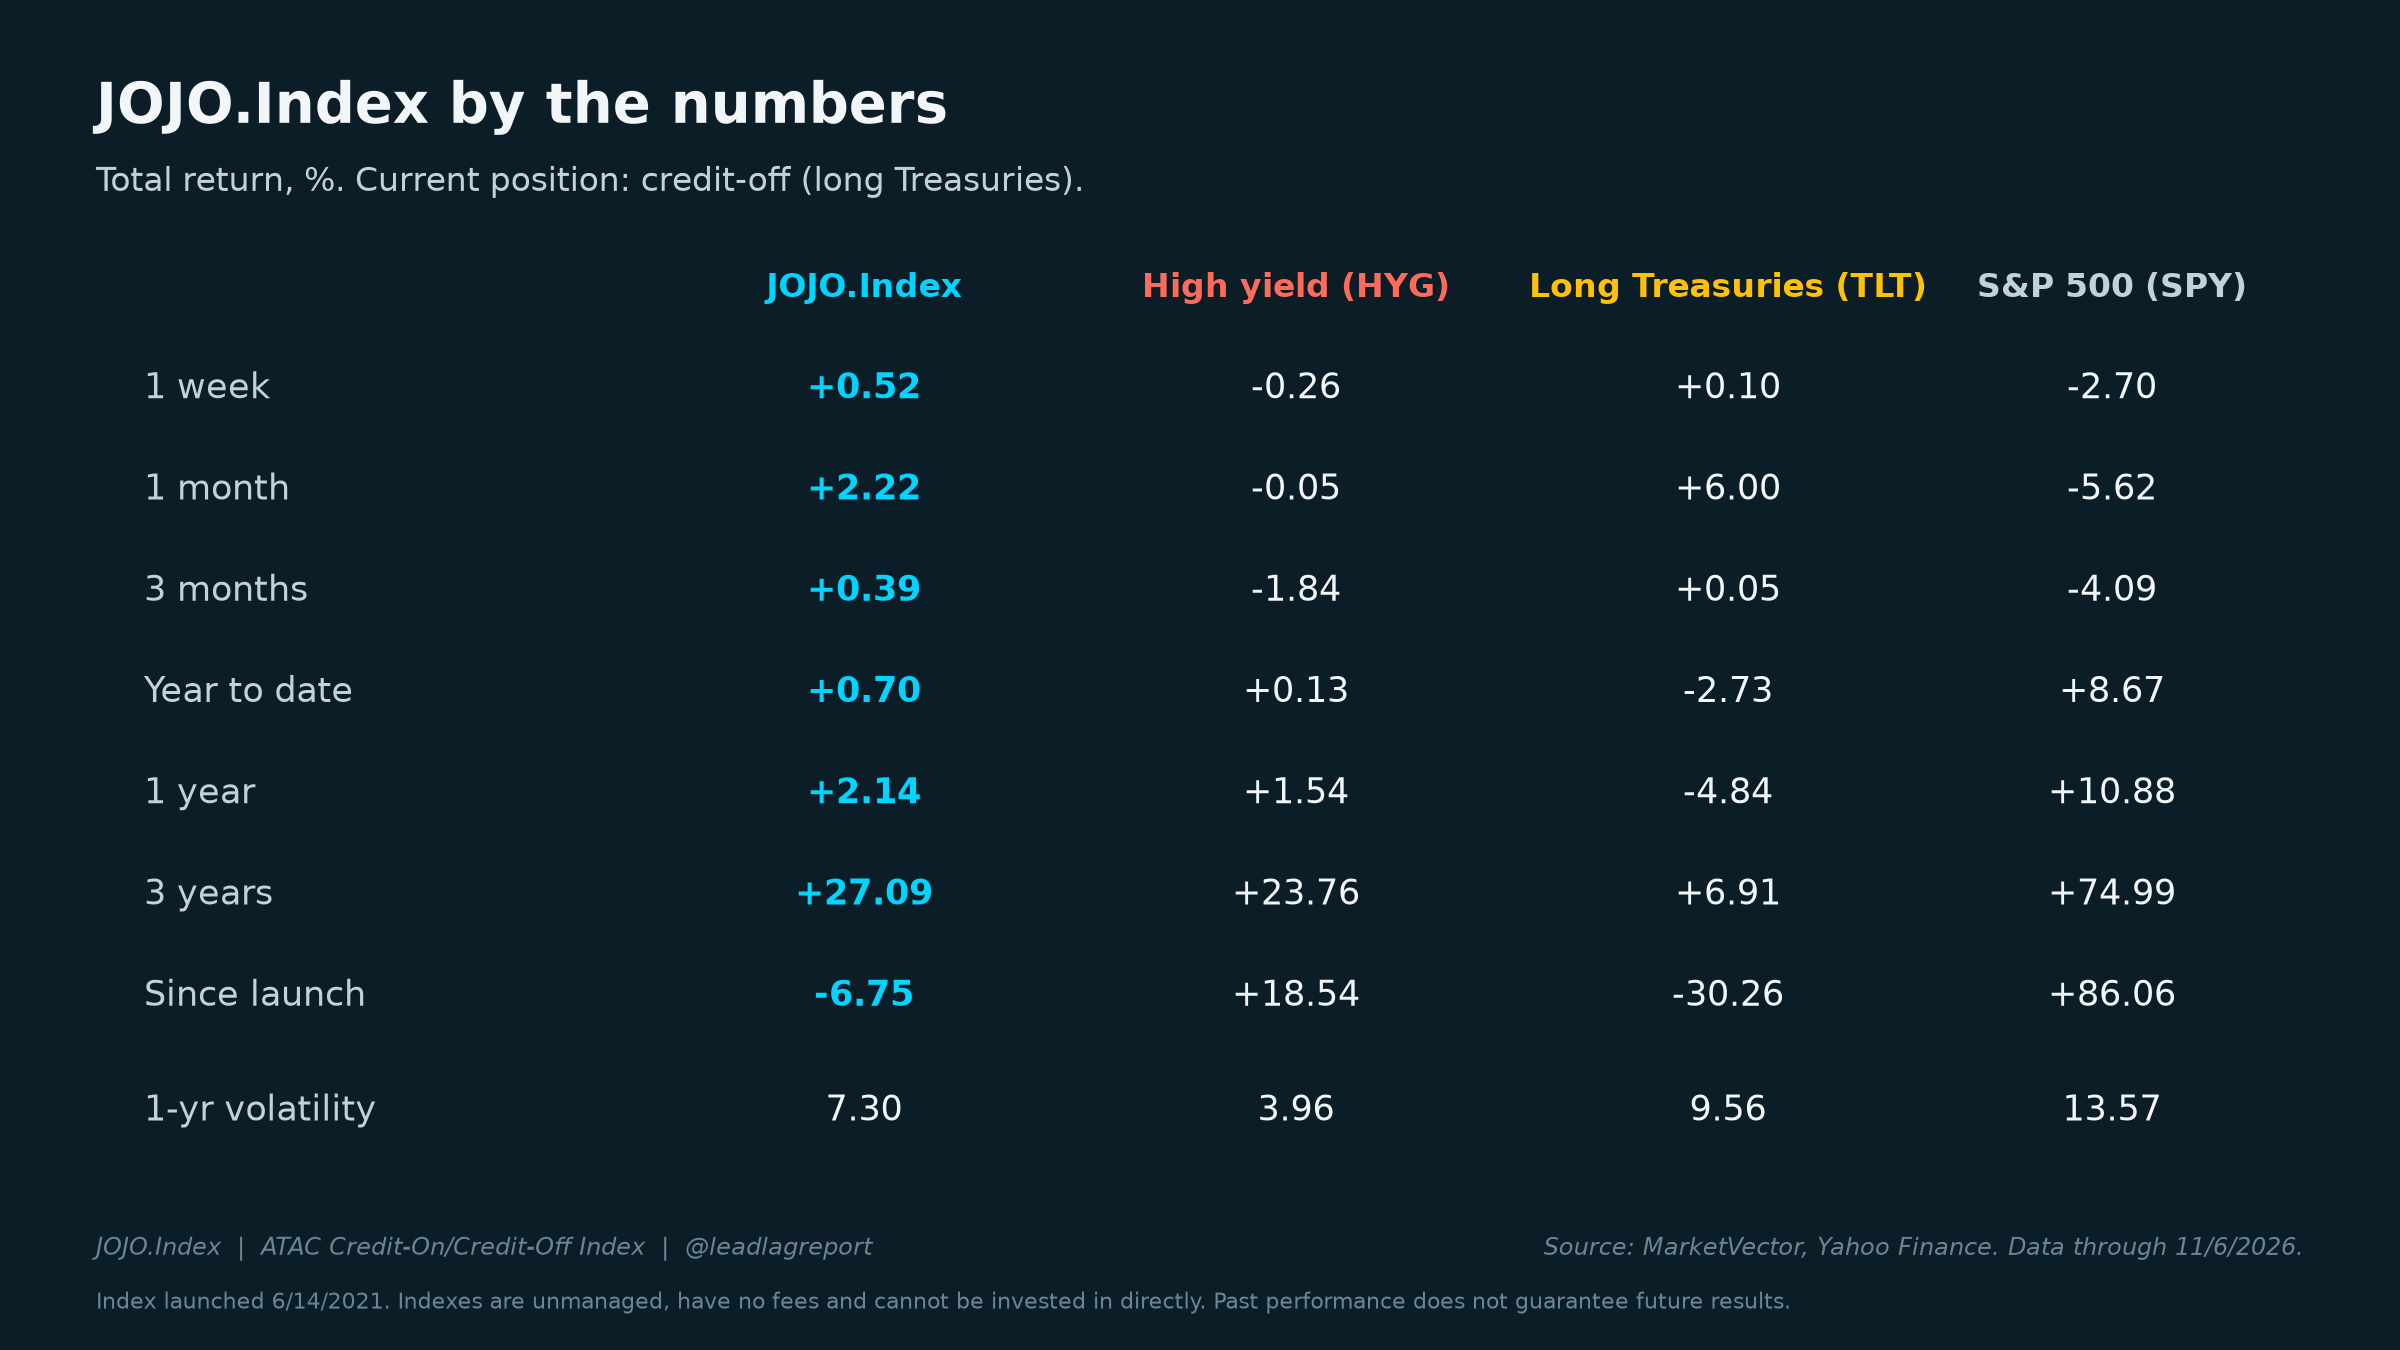
Live record, total return: 1 week +0.52%, 1 month +2.22%, year to date +0.7%, 3 years +27.09%, since the June 2021 launch -6.75%, or -1.29% a year.
The past month: S&P 500 -5.62%, high yield -0.05%, long Treasuries +6.0%. The bigger picture is still weak. 2022 cost the index 24.99% as long Treasuries, the defensive sleeve, fell 31.23%, and it sits 8.14% below its high. The full table is below, good and bad.
The JOJO.Index is the ATAC Credit-On/Credit-Off Index, administered by MarketVector, launched 6/14/2021. Results before launch are backtested and hypothetical, not actual performance. Indexes are unmanaged, have no fees and cannot be invested in directly.
Past performance is not indicative of future results. Regime history is a Lead-Lag estimate from daily index returns. Sources: MarketVector, Yahoo Finance, ICE BofA via FRED. Not investment advice.
The Lead-Lag Report is provided by Lead-Lag Publishing, LLC. All opinions and views mentioned in this report constitute our judgments as of the date of writing and are subject to change at any time. Information within this material is not intended to be used as a primary basis for investment decisions and should also not be construed as advice meeting the particular investment needs of any individual investor. Trading signals produced by the Lead-Lag Report are independent of other services provided by Lead-Lag Publishing, LLC or its affiliates, and positioning of accounts under their management may differ. Please remember that investing involves risk, including loss of principal, and past performance may not be indicative of future results. Lead-Lag Publishing, LLC, its members, officers, directors and employees expressly disclaim all liability in respect to actions taken based on any or all of the information on this writing.