Copper Says the 10-Year Is Headed Higher. Bonds Disagree.
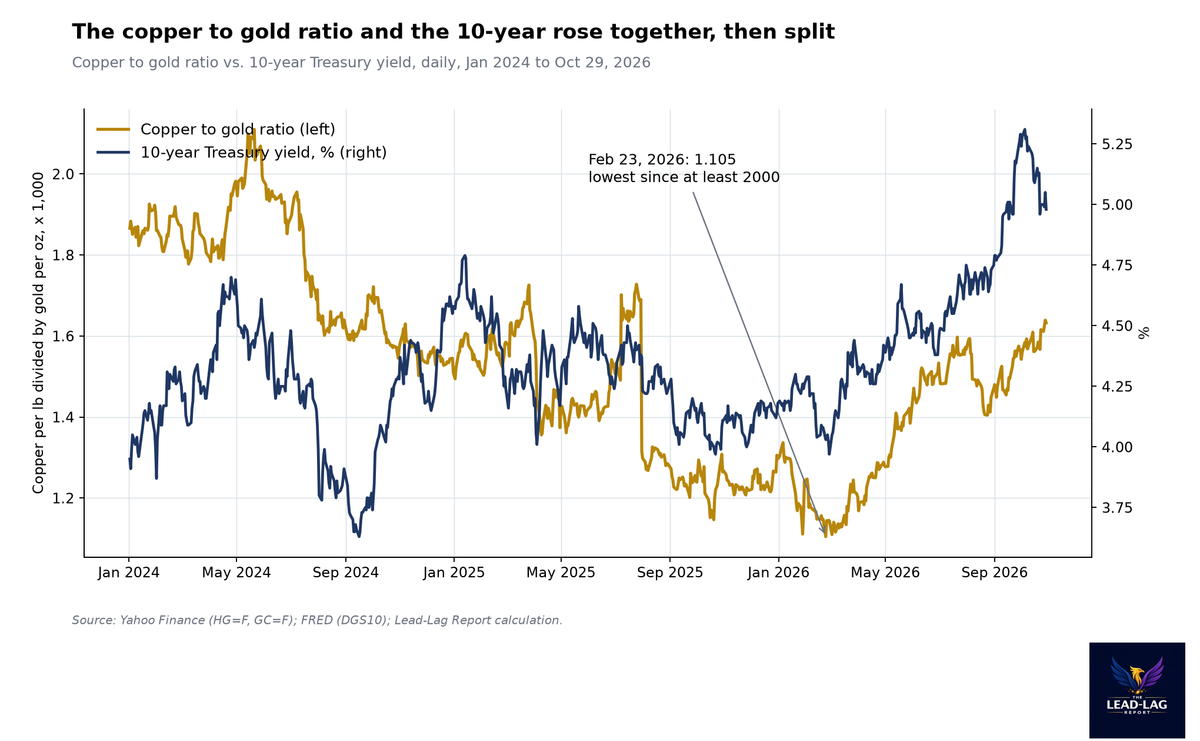
The copper to gold ratio is up 48% since its February low, and the 10-year yield rose 95 basis points with it. In October the ratio rose 7% while the 10-year fell 31 basis points.


Special Announcement
Not everything in this market needs to be an AI trade.
The Tuttle Capital Heavy Asset Low Obsolescence ETF (HALX) tracks a rules-based index of U.S. companies with a different profile from many AI-related companies: heavy tangible assets, durable asset-backed cash flow, and low reliance on digitizable, asset-light business models — think regulated utilities, freight rail, pipelines, and materials producers.
The underlying index, built and maintained by VettaFi, scores companies on a "HALO Score" — tangible asset intensity, cash flow durability, and low digital-substitution risk — and holds roughly 30–50 constituents, equal-weighted, rebalanced quarterly.
Launched May 19, 2026 on Cboe. Passively managed.
Learn more at https://www.halxetf.com/
Important Disclosures
Investors should carefully consider the investment objectives, risks, charges, and expenses of the Tuttle Capital Heavy Asset Low Obsolescence ETF (HALX) before investing. For a prospectus with this and other information about the Fund, please visit https://halxetf.com or call (833) 759-6110. Please read the prospectus carefully before investing.
Investment in the Fund is subject to investment risks, including the possible loss of some or the entire principal amount invested. There can be no assurance that the Fund will be successful in meeting its investment objective.
Limited History of Operations Risk: As of the date of this prospectus, the Fund has no operating history and currently has fewer assets than larger funds. Like other new funds, large inflows and outflows may impact the Fund's market exposure for limited periods of time. This impact may be positive or negative, depending on the direction of market movement during the period affected.
Index Tracking Risk: Returns may not match its reference Index due to costs, timing differences, or operational constraints. The Fund will hold reference index securities regardless of outlook, which may lead to underperformance versus active strategies.
Non-Diversification Risk: The Fund is considered to be non-diversified, which means that it may invest more of its assets in the securities of a single issuer or a smaller number of issuers than if it were a diversified fund. To the extent the Fund invests a significant percentage of its assets in a limited number of issuers, the Fund is subject to the risks of investing in those few issuers and may be more susceptible to a single adverse economic or regulatory occurrence. As a result, changes in the market value of a single security could cause greater fluctuations in the value of Fund shares than would occur in a diversified fund.
There is no guarantee that the Fund's investment strategy will be properly implemented, and an investor may lose some or all of its investment. The Fund's focus on companies with tangible asset intensity and characteristics associated with durable, asset-backed cash flows does not constitute a forecast of technological developments or a guarantee of reduced exposure to artificial intelligence or other innovations. The theme underlying the Fund may fall out of favor, underperform broader equity markets, or experience periods of significant volatility. Companies with high fixed costs and significant capital expenditure requirements may experience amplified earnings volatility during periods of reduced demand.
The Fund is non-diversified and may invest a greater percentage of its assets in a smaller number of issuers than a diversified fund, which may increase the volatility of the Fund's returns. ETF shares may trade at a premium or discount to NAV. References to specific companies and sectors are for illustrative purposes only, reflect the Index universe as of a recent reconstitution, and are subject to change at each quarterly reconstitution. Such references do not constitute a recommendation to buy, sell, or hold any security. Any reference to a third party, including VettaFi LLC, does not imply endorsement of the Fund.
Distributor: Foreside Fund Services, LLC
DISCLAIMER – PLEASE READ: This is sponsored advertising content for which Lead-Lag Publishing, LLC has been paid a fee. The information provided in the link is solely the creation of Tuttle Capital Management. Lead-Lag Publishing, LLC does not guarantee the accuracy or completeness of the information provided in the link or make any representation as to its quality. All statements and expressions provided in the link are the sole opinion of Tuttle Capital Management and Lead-Lag Publishing, LLC expressly disclaims any responsibility for action taken in connection with the information provided in the link.
The ratio of copper to gold hit its lowest level since at least 2000 in February. Since then it has risen 48%, and the 10-year Treasury yield has risen almost a full percentage point with it. In October the two split: the ratio rose 7% while the 10-year fell 31 basis points. I think the ratio is the one telling the truth.
MICHAEL A. GAYED, CFA
Key Highlights
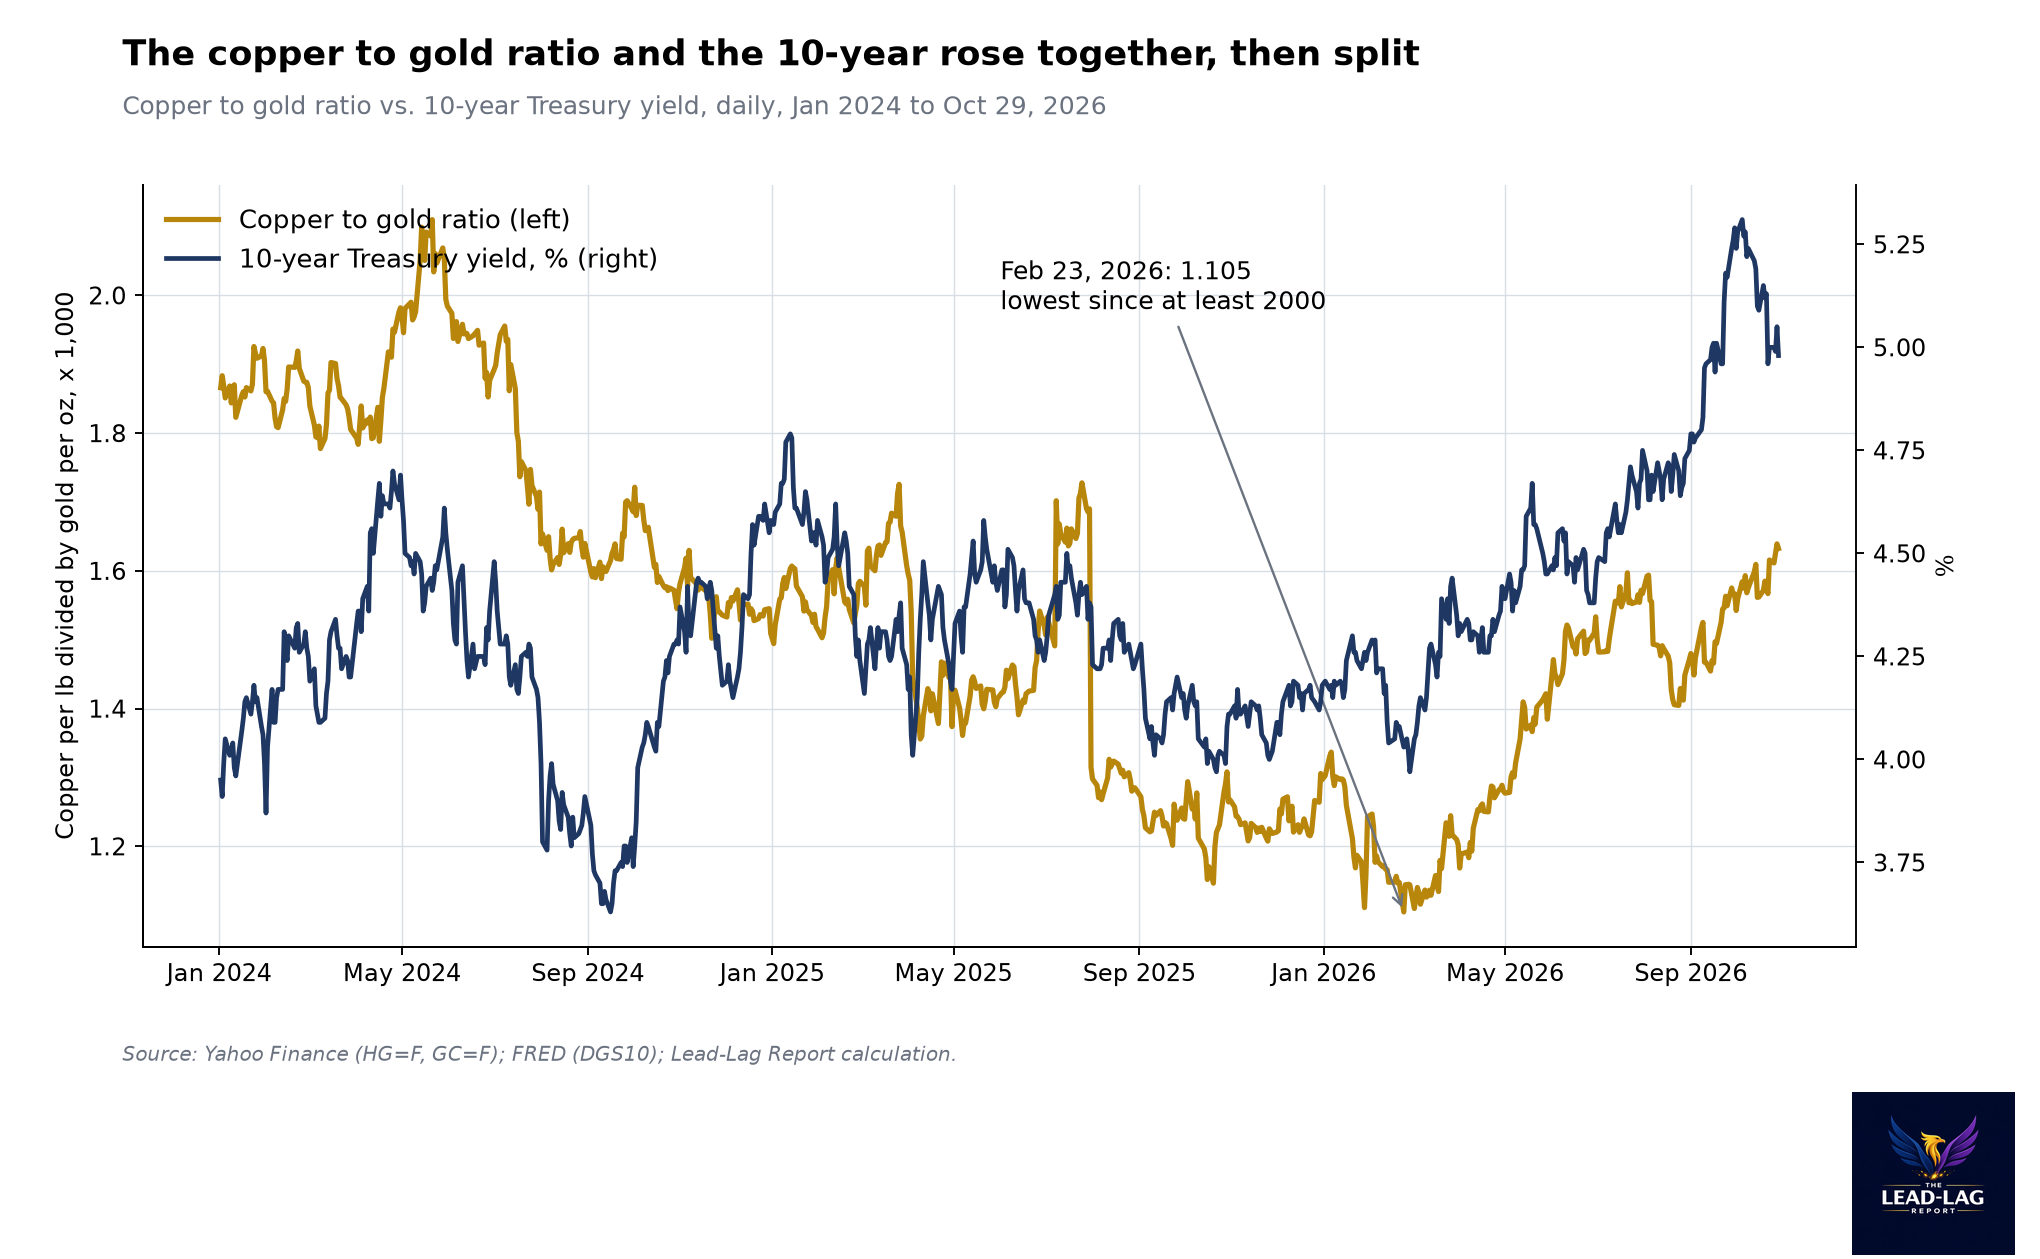
- The copper to gold ratio, measured as COMEX copper in dollars per pound divided by gold in dollars per ounce, times 1,000, rose from 1.105 on February 23, 2026, its lowest reading since at least 2000, to 1.632 on October 29, a gain of 48%, by my calculation.1, 2
- Over the same span the 10-year Treasury yield rose from 4.03% to 4.98%, a gain of 95 basis points.3
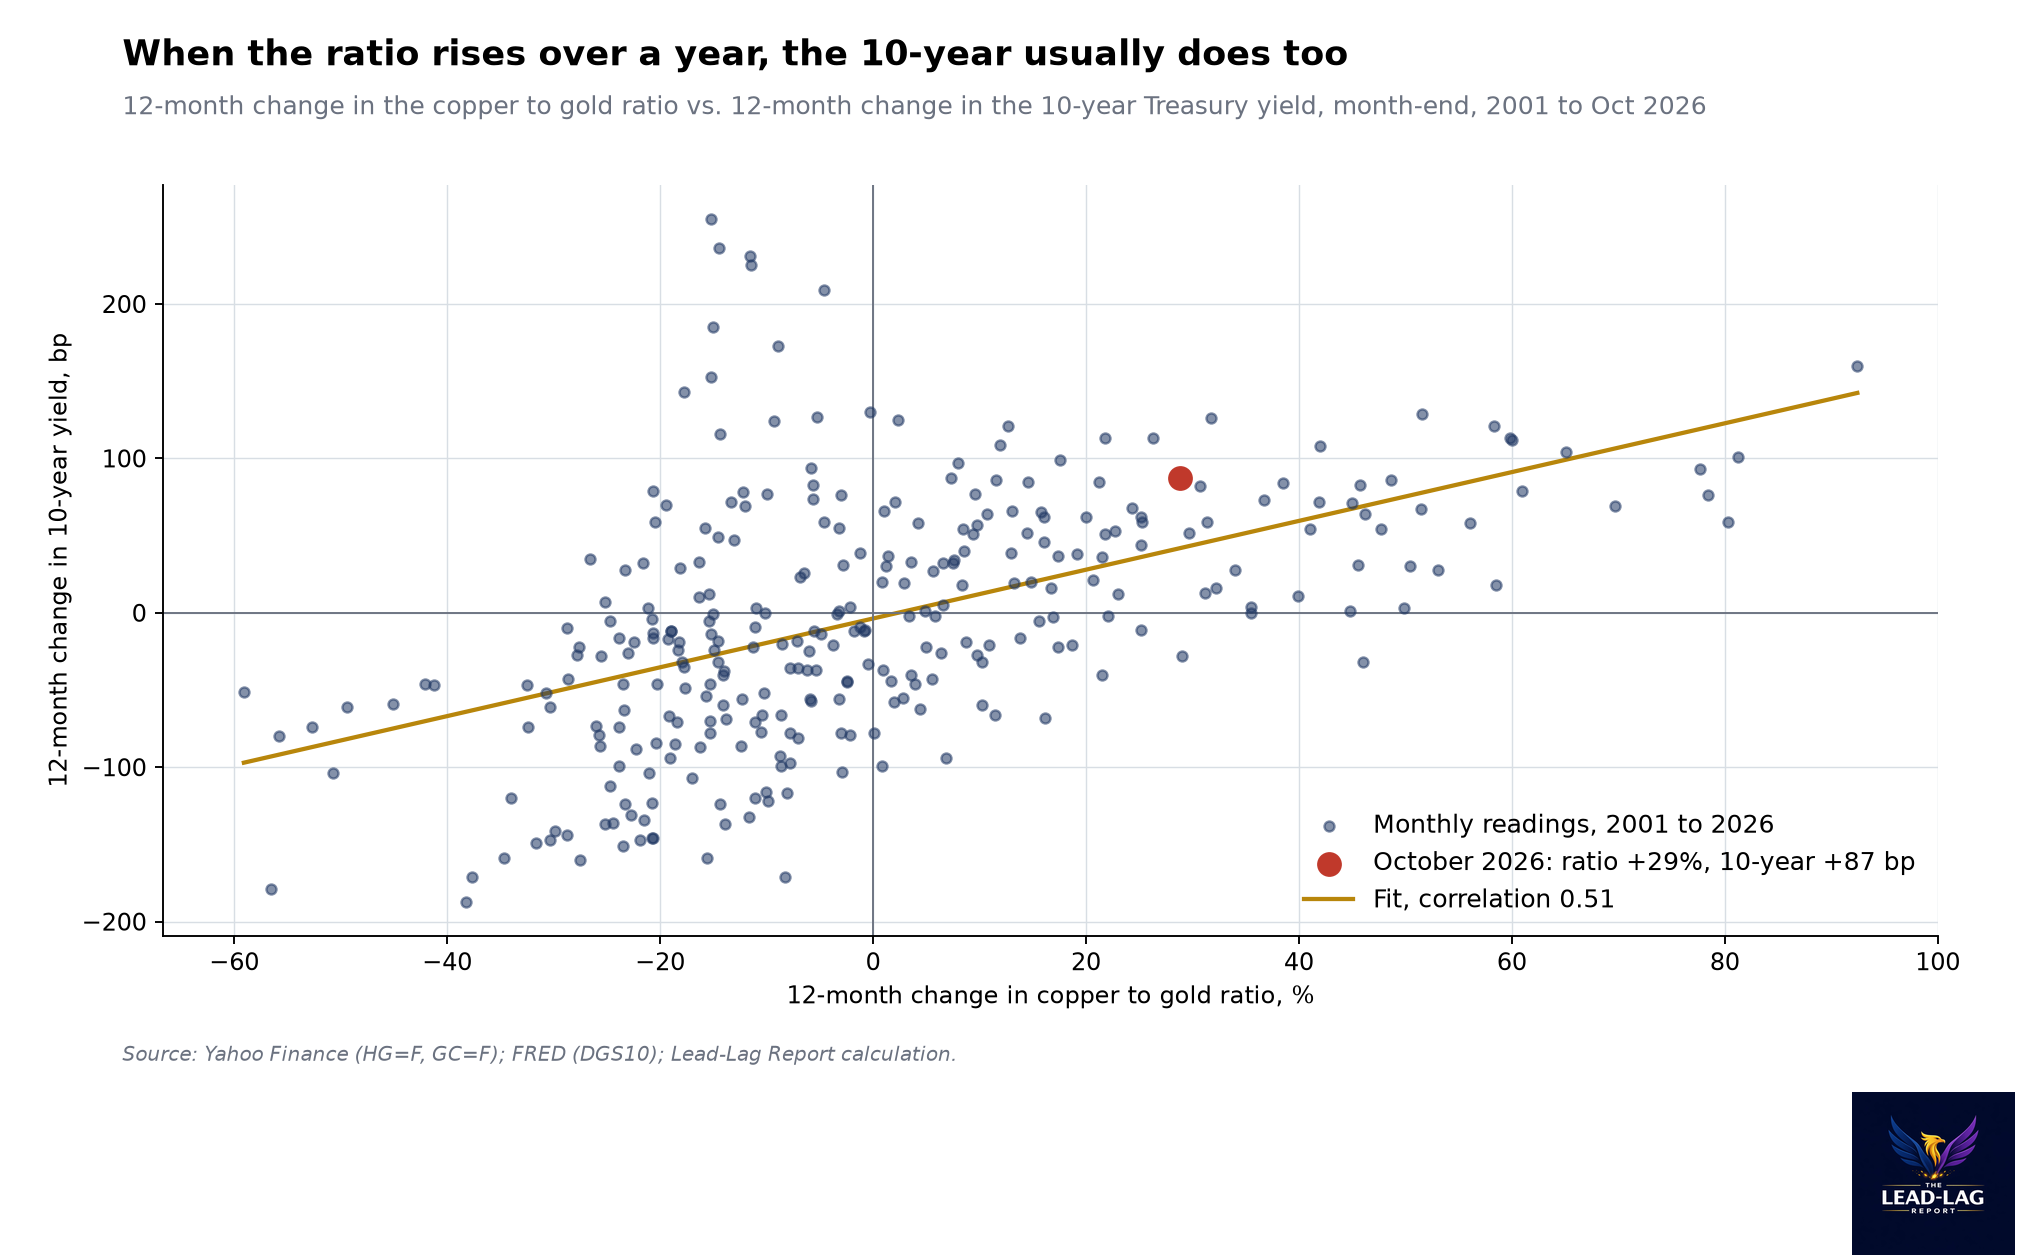
- Since 2001, 12-month changes in the ratio and 12-month changes in the 10-year yield have had a correlation of 0.51. Over the past 12 months the ratio is up 29% and the 10-year yield is up 87 basis points.1, 2, 3
- In October gold fell 7.2% and copper fell 0.8%, lifting the ratio 7.0%, while the 10-year yield fell from 5.29% to 4.98%.1, 2, 3
Two Metals, One Message About Rates
Copper and gold sit at opposite ends of the economic mood. Copper goes into wiring, construction, power grids and, more recently, data centers, so its price tends to rise when investors expect stronger growth and more demand. Gold is the asset people buy when they are worried, and it tends to do best when real interest rates fall or when fear rises. Dividing one by the other strips out a lot of the noise that moves both, such as the dollar, and leaves a rough read on whether markets are leaning toward growth or toward safety.
That is why the ratio has long been watched alongside Treasury yields. When the ratio rises, it says investors are favoring growth over safety, which usually comes with higher yields. When it falls, the opposite. The link is far from perfect, but over long stretches the two have tended to move together.
My view is that the ratio's 48% rise since February is a better guide to where the 10-year is headed than the 31 basis point drop in yields during October. The October rally in Treasuries was a flight to safety during a selloff in technology stocks. The metals market, at least so far, is saying the growth and inflation backdrop has not changed much.
From A Record Low To A Sharp Rebound
The ratio fell to 1.105 on February 23, 2026, the lowest reading in data going back to August 2000.1, 2 At that point gold was near its peak. COMEX gold closed at a record $5,318.40 an ounce on January 29 and was still at $5,225.60 on February 23, while copper traded at $5.77 a pound.2, 1 The ratio's low was a sign of how much fear was priced into gold relative to the growth outlook priced into copper.
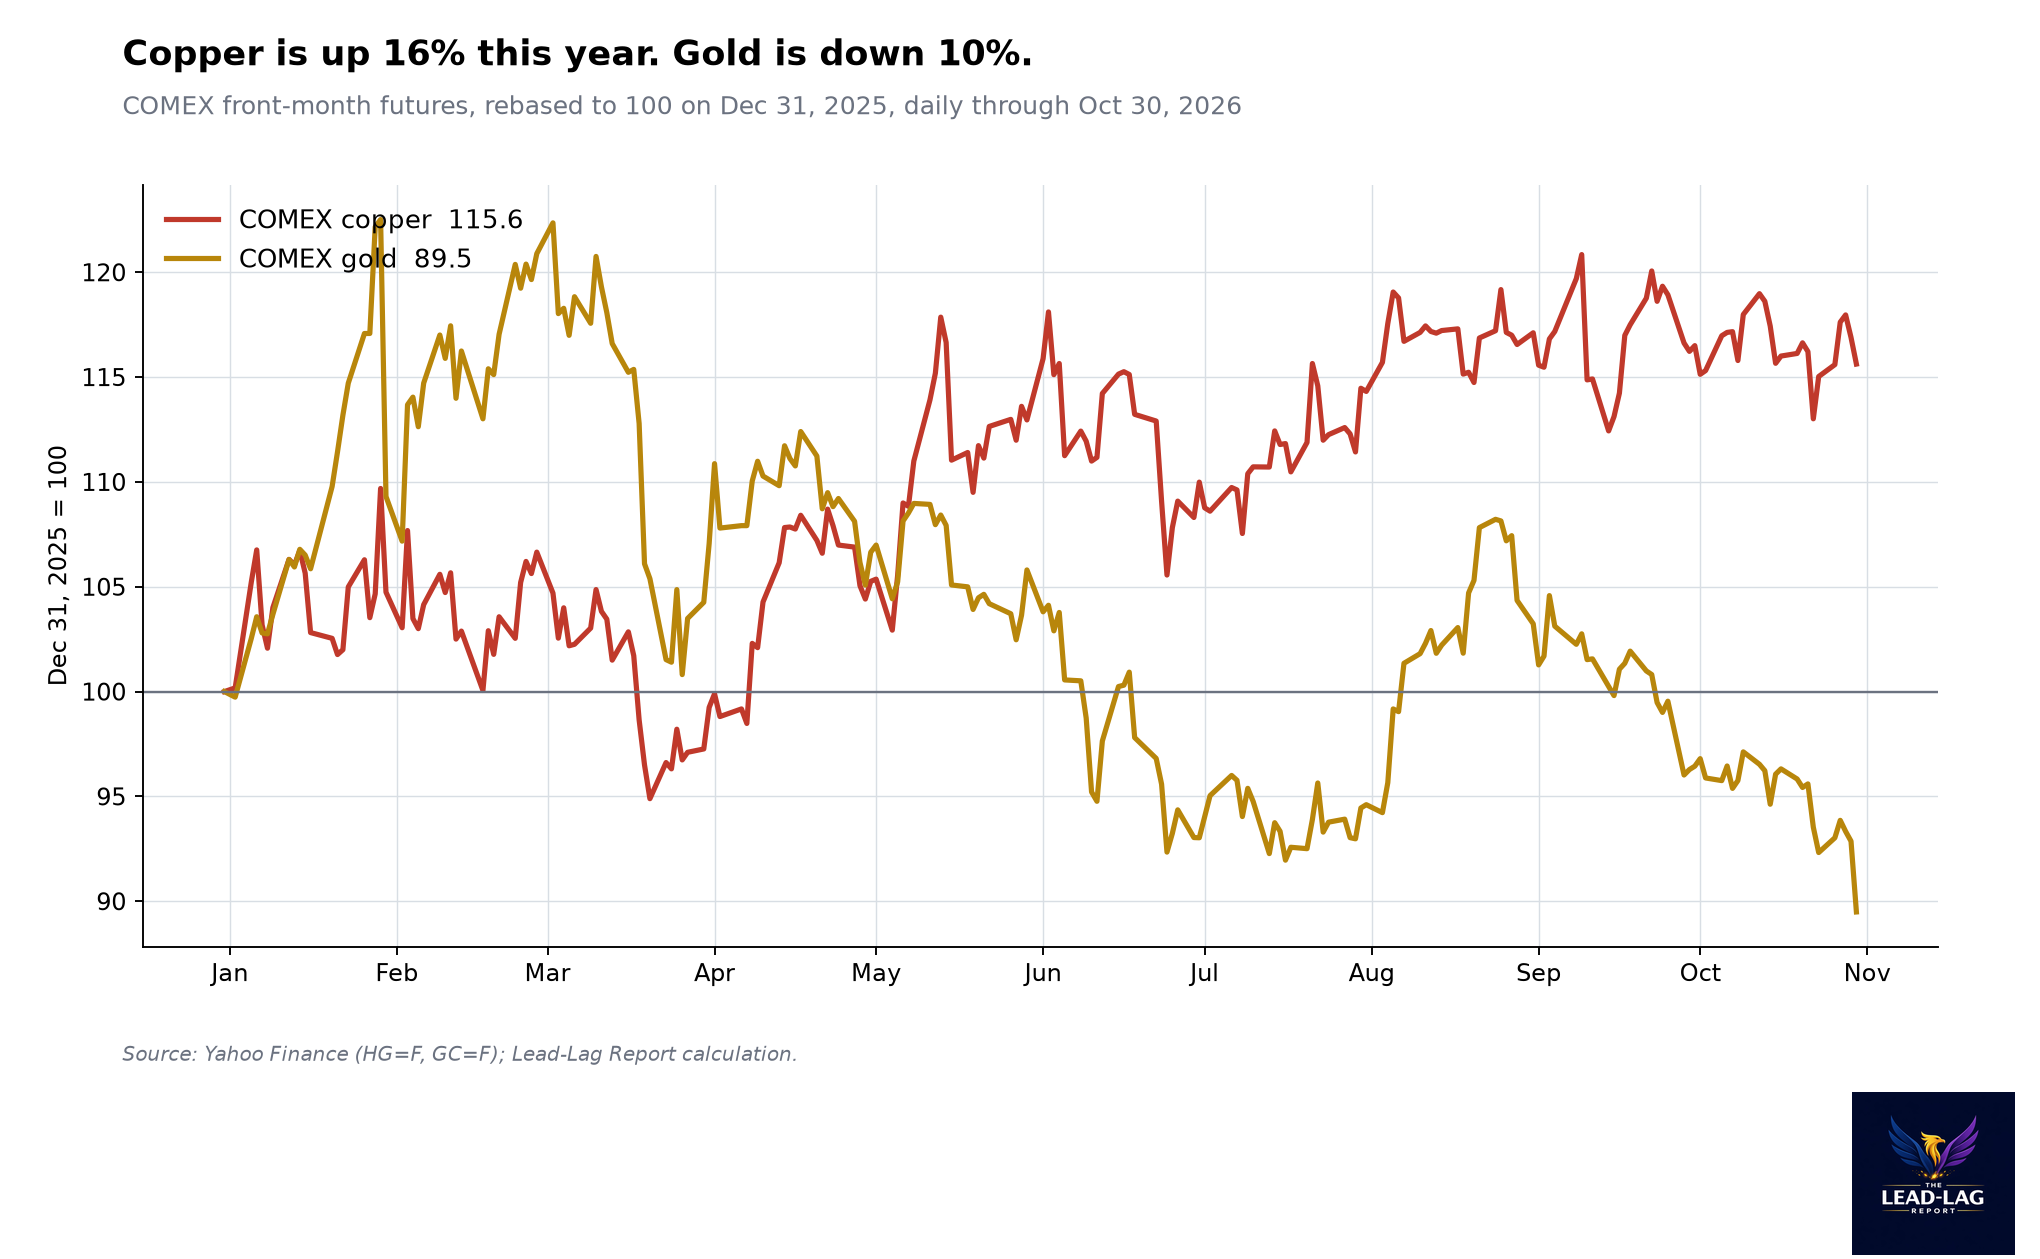
Since then the two metals have moved in opposite directions. Gold closed at $3,884.90 on October 30, down 27.0% from its record and down 10.5% for the year.2 Copper closed at $6.51 a pound, up 15.6% for the year and 4.3% below its record close of $6.80 on September 9.1 Reuters reported that London copper hit a record of $14,875 a metric ton on September 10, helped by shipments diverted to the United States ahead of potential tariffs and by expectations of demand from AI data centers.5
The result is a ratio that has risen 48% in eight months, from 1.105 to 1.632 on October 29, and to 1.676 on October 30 after gold's latest drop.1, 2 Even after that move, the ratio is in the 13th percentile of its daily readings since 2000, and well below its 2010 to 2019 average of 2.28.1, 2 That low level partly reflects gold's long rally over the past several years, which has kept the ratio depressed even as copper has climbed.
How Closely The Ratio Tracks The 10-Year
The link between the ratio and the 10-year is clearer in changes than in levels. Because gold has risen so much more than copper over the past decade, the level of the ratio has drifted lower while yields have risen, and the correlation of the two levels since 2010 is slightly negative, at minus 0.15.1, 2, 3 That is a structural shift in gold, not a sign that the relationship has broken.
Changes tell a different story. Since 2001, the 12-month change in the ratio and the 12-month change in the 10-year yield have had a correlation of 0.51. Using quarter-end readings since 2010, the correlation of quarterly changes is 0.54.1, 2, 3 For weekly changes from 2010 to 2025, the correlation is 0.35.1, 2, 3 So over a few months or a year, a rising ratio has tended to come with a rising 10-year.
The past 12 months fit that pattern. The ratio is up 29% and the 10-year yield is up 87 basis points over the year to October.1, 2, 3 The 10-year reached 5.29% at the end of September, its highest month-end reading of 2026, as the ratio rose through the summer.3
October Broke The Pattern
In October the two parted ways. Gold fell 7.2% for the month, and Reuters reported it hit a three and a half month low on October 30 as markets priced a possible Fed hike.2, 6 Copper fell only 0.8% by my count, though Reuters reported London copper was on course for a 1.8% loss for the month as higher oil prices and the tech selloff weighed on risk appetite.1, 4 The ratio rose 7.0%.1, 2
At the same time, the 10-year yield fell from 5.29% on September 30 to 4.98% on October 29.3 That was a flight to safety. Chip stocks fell 7.2% on October 30 after results from Intel and Amazon, and the Nasdaq Composite fell 2.86%, its largest one-day drop since June.7
Divergences this large have been rare. Since 2000, I found only two other months where the ratio rose at least 5% while the 10-year yield fell at least 20 basis points: March 2009 and January 2023.1, 2, 3 In both, the 10-year yield was higher six months later, by 60 basis points after March 2009 and by 45 basis points after January 2023.3 Two cases are far too few to build a rule on. But they fit the idea that when Treasuries rally on fear while industrial metals hold up, the rally in bonds has tended to fade.
Why I Lean Toward The Ratio
Three things make me think the ratio has the better read.
The first is the Fed. The Federal Reserve raised its target range in September and held on October 28, with two officials voting for another hike.8 Gold has fallen as hike expectations rose, which is what you would expect when the cost of holding a metal that pays no income goes up.6 A falling gold price driven by a hawkish Fed is not a sign of a weaker economy. It is a sign of tighter policy.
The second is copper's resilience. Copper is the more economically sensitive of the two, and it held near its highs through a month that included the worst day for chip stocks since June.1, 7 Goldman Sachs raised its end-2026 copper forecast to $14,700 a ton in October, citing weaker mine supply and tighter markets outside the United States.9 Supply constraints are part of copper's strength, and I will come back to that below. But a metal that is still up 15.6% for the year is not signaling a collapse in demand.1
The third is oil. Brent crude rose 13.6% in October, which keeps the inflation side of the yield story alive.10 A 10-year yield that falls while oil rises and gold falls on hike fears is a yield that is reacting to the stock market, not to the inflation outlook. I wrote recently that the 10-year's move toward 5.31% was not about inflation expectations, and the October rally looks to me like the same market reversing a bit of that move on fear.11
What This Means For Bond Investors
For investors who added duration during the October rally, the ratio is a caution flag. If the 10-year moves back toward where the ratio implies, using the past year's relationship as a guide, the rally in long bonds could give back some of its gains. The front end of the curve looks safer. Short-term yields are already pricing more Fed hikes, and they do not depend on whether the October flight to safety lasts.
For equity investors, a rising ratio is usually a better sign for economically sensitive parts of the market, such as industrials, materials and energy, than for long-duration growth stocks. That fits October, when chip stocks posted a monthly loss of more than 15% while copper barely moved.7, 1 A rising ratio and a falling Nasdaq can coexist when the issue is valuation and spending, not the economy.
I would not use the ratio as a precise forecast. Its relationship with yields is loose, and it can stay apart from the bond market for months. I use it as a cross-check, and right now it disagrees with the bond market's October rally.
The Case Against Me
The strongest argument against my view is that copper's strength is about supply, not demand. Reuters has reported that inventories outside the United States fell as traders shipped metal to the country ahead of possible tariffs on refined copper, which helped drive the September record.5 If that is the main driver, the ratio is telling us about trade policy and stockpiling, not about growth. In that case, its rise says little about where yields should go.
The second argument is that gold's fall is about positioning. Gold rose to a record in January after a long run, and a 27% decline from that peak could be the unwinding of a crowded trade rather than a verdict on the economy.2 If so, the ratio's rise mostly reflects gold's correction, and it would be a mistake to read it as a signal for the 10-year.
The third argument is that the level correlation since 2010 is negative.1, 3 Someone who looked only at levels would conclude the ratio has no useful link to yields. I think the change correlations are the better test, but the level data is a reminder that this relationship has been unstable.
What Would Change My View
I am watching three things. First, if the ratio falls back below 1.50, where it ended August, while the 10-year keeps falling, the two would be back in agreement, and the case for a further bond rally would get stronger.1, 2, 3
Second, if copper drops below $6.00 a pound, about 8% below its October 30 close, that would suggest the AI demand story and the tariff-driven tightness are both fading, and I would put less weight on the ratio.1
Third, if the Fed signals that it is done raising rates in December, gold could recover quickly, pulling the ratio lower. In that case, the October rally in bonds would have been an early read on policy, not just fear.8
How This Fits What I Have Written
This piece connects to two recent Macro Observations. "The 10-Year Hit 5.31%. The Bond Market Says It Is Not Inflation." argued that the bond market was not treating the rise in long yields as an inflation story.11 "Treasuries Are a Hedge Again. Credit and Oil Explain Why." explained why long Treasuries regained their role as a hedge, which is the role they played in October.12
The Takeaway
The copper to gold ratio has risen 48% since its February low, and the 10-year yield rose 95 basis points over the same stretch.1, 2, 3 In October the two split, with the ratio up 7% and the 10-year down 31 basis points. History offers only a couple of cases like that, and in both the 10-year was higher six months later. My read is that the October bond rally was a reaction to the tech selloff, not a change in the growth and inflation outlook, and that the metals market has the better read on where long yields go next.
Annual paying members get a free print copy of The Price of a Quiet Yen or Intermarket Analysis and Investing, Third Edition (retail value up to $44.95, U.S. shipping): leadlagreport.com/annual. If you have read either book, an honest Amazon review helps other readers find it: The Price of a Quiet Yen and Intermarket Analysis and Investing.
Notes
- [1] COMEX copper front-month futures (HG=F) daily closes, Aug 2000 to Oct 30, 2026, via Yahoo Finance. Ratio, percentiles, correlations and divergence months are Lead-Lag Report calculations: finance.yahoo.com/quote/HG%3DF/history/
- [2] COMEX gold front-month futures (GC=F) daily closes, Aug 2000 to Oct 30, 2026, via Yahoo Finance: finance.yahoo.com/quote/GC%3DF/history/
- [3] Board of Governors of the Federal Reserve System, Market Yield on U.S. Treasury Securities at 10-Year Constant Maturity (DGS10), via FRED; 4.03% on Feb 23, 5.29% on Sep 30 and 4.98% on Oct 29, 2026: fred.stlouisfed.org/series/DGS10
- [4] Reuters via Kitco, "Copper price set for first monthly loss since June as AI spending worries weigh," October 30, 2026: www.kitco.com/news/off-the-wire/2026-10-30/copper-price-set-first-monthly-loss-june-ai-spending-worries-weigh
- [5] Reuters via Mining.com, "Copper price falls as LME stocks edge higher and mine supply concerns ease," October 2026 (record $14,875 a ton on September 10; shipments diverted to the U.S.): www.mining.com/web/copper-price-falls-as-lme-stocks-edge-higher-and-mine-supply-concerns-ease/
- [6] Reuters, "Gold hits 3-1/2-month low on Fed hike fears, set for monthly loss," October 30, 2026: www.reuters.com/world/india/gold-slips-higher-oil-us-inflation-data-bolster-fed-hike-bets-2026-10-30/
- [7] Reuters via The Charlotte Observer, "Wall Street closes sharply lower as AI cash burn fears spark tech selloff," October 30, 2026: www.charlotteobserver.com/news/nation-world/national/article317845088.html
- [8] Federal Reserve FOMC statement, October 28, 2026: www.federalreserve.gov/newsevents/pressreleases/monetary20261028a.htm
- [9] Reuters via The Hindu BusinessLine, "Copper rises as US inventories, bullish outlook builds," October 21, 2026 (Goldman Sachs end-2026 forecast of $14,700 a ton): www.thehindubusinessline.com/markets/commodities/copper-rises-as-us-inventories-bullish-outlook-builds/article71603770.ece
- [10] Reuters via The State, "Oil set for fourth monthly gain as Hormuz tanker attack highlights supply risks," October 30, 2026: www.thestate.com/news/nation-world/national/article317843179.html
- [11] The Lead-Lag Report, "The 10-Year Hit 5.31%. The Bond Market Says It Is Not Inflation.": www.leadlagreport.com/the-10-year-hit-5-31-the-bond-market-says-it-is-not-inflation/
- [12] The Lead-Lag Report, "Treasuries Are a Hedge Again. Credit and Oil Explain Why.": www.leadlagreport.com/treasuries-are-a-hedge-again-credit-and-oil-explain-why/