The Best Six Months Start in a Midterm Year. The Fed Is the Catch.
November to April after a midterm election has been positive 19 of 19 times since 1950. When the Fed was hiking going in, gains were smaller and the dips along the way were deeper.

Special Announcement

Today’s Lead-Lag Report is brought to you by our friends at Alexis Investment Partners — the father-daughter RIA and ETF issuer behind the Practical Tactical framework and the NASDAQ-listed Alexis Practical Tactical ETF (LEXI).
High valuations and an aging secular bull market threaten to re-assert sequence of returns risks that can ravage retirement income plans. Practical Tactical was built for this — a multi-asset, model informed framework managed by Jason Browne and Alexis Browne Roberts, seeking to add value through market cycles by:
- Participating more in up than down markets
- Pursuing leading sectors and regions and minimizing exposure to laggards
- Incorporating a broader range of asset classes and strategies than traditional balanced portfolios
That framework is wrapped in an ETF — a tax efficient tactical allocation sleeve advisors can use to complement strategic portfolios.
To learn more about the ETF, visit www.lexietf.com. Access AIP’s media content, monthly newsletter and learn more about practical tactical investing at www.alexisinvests.com.
Before investing carefully consider the fund’s investment objective, risks, charges, and expenses contained in the prospectus available at www.lexietf.com. Please read the prospectus carefully. Investing involves risk including possible loss of principal. Distributor: Foreside Fund Services, LLC
DISCLAIMER – PLEASE READ: This is sponsored advertising content for which Lead-Lag Publishing, LLC has been paid a fee. The information provided in the link is solely the creation of Alexis Investment Partners. Lead-Lag Publishing, LLC does not guarantee the accuracy or completeness of the information provided in the link or make any representation as to its quality. All statements and expressions provided in the link are the sole opinion of Alexis Investment Partners, and Lead-Lag Publishing, LLC expressly disclaims any responsibility for action taken in connection with the information provided in the link.
The S&P 500's favorite six months began this week, and 2026 is a midterm year. Since 1950, the November to April stretch after a midterm election has been positive 19 times out of 19. The catch is the Fed. When it has been raising rates going in, the average gain has been smaller and the ride rougher.
MICHAEL A. GAYED, CFA
Key Highlights
- Since 1950 the S&P 500 has risen from the end of October to the end of April in 58 of 76 years, with an average price gain of 7.0%, against 2.1% from the end of April to the end of October, by my calculation.1
- In the 19 midterm election years since 1950, the November to April stretch has been positive every time, with an average gain of 14.8% and a smallest gain of 3.3%.1, 2
- When the effective fed funds rate rose at least 25 basis points from April to October, the following November to April averaged 4.6%, against 8.1% in other years, and the median worst decline along the way was 4.2%, against 2.2%.1, 5
- The S&P 500 enters the period at 7,580.07 after a 0.9% loss in October, with the Fed having raised its target range in September and two officials voting for another hike on October 28.1, 6
The Best Six Months Start Now
The stretch from November through April has a long history as the stronger half of the stock market year. Yale Hirsch documented the pattern in the Stock Trader's Almanac, and his son Jeffrey Hirsch has carried the work forward.2, 3 Fidelity notes that since 1945, the S&P 500 has delivered an average price gain of roughly 7% from November to April, against about 2% from May to October.4
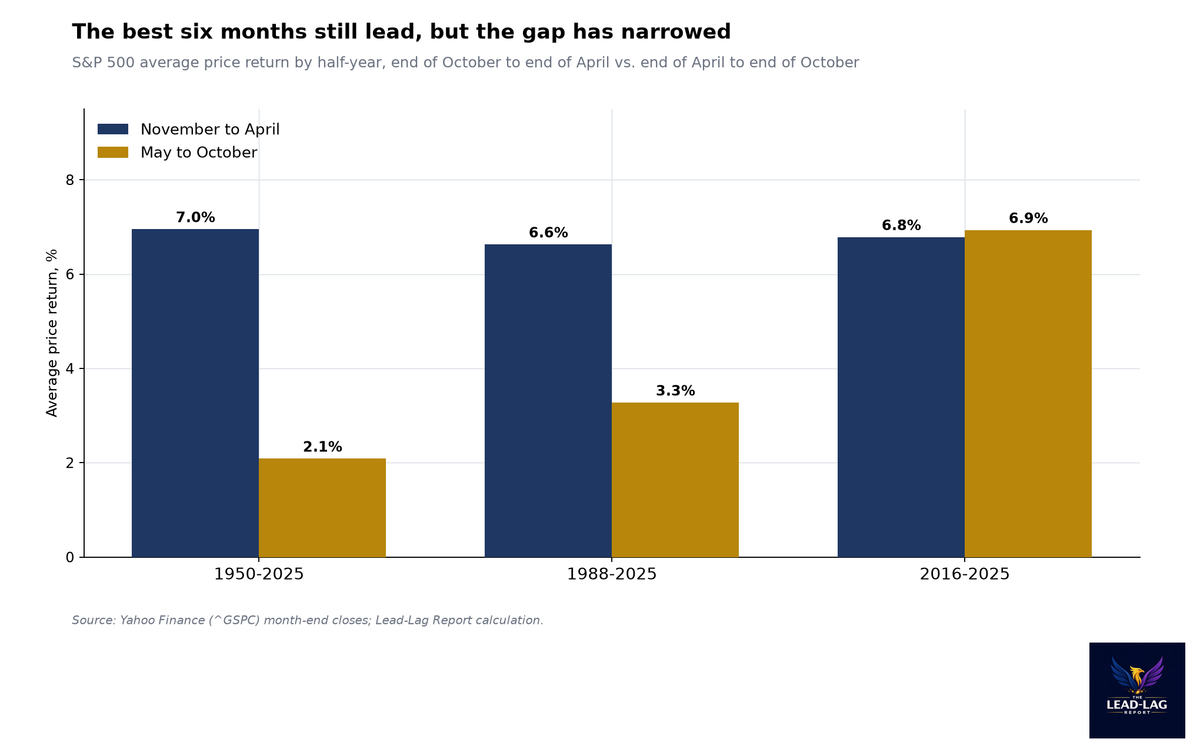
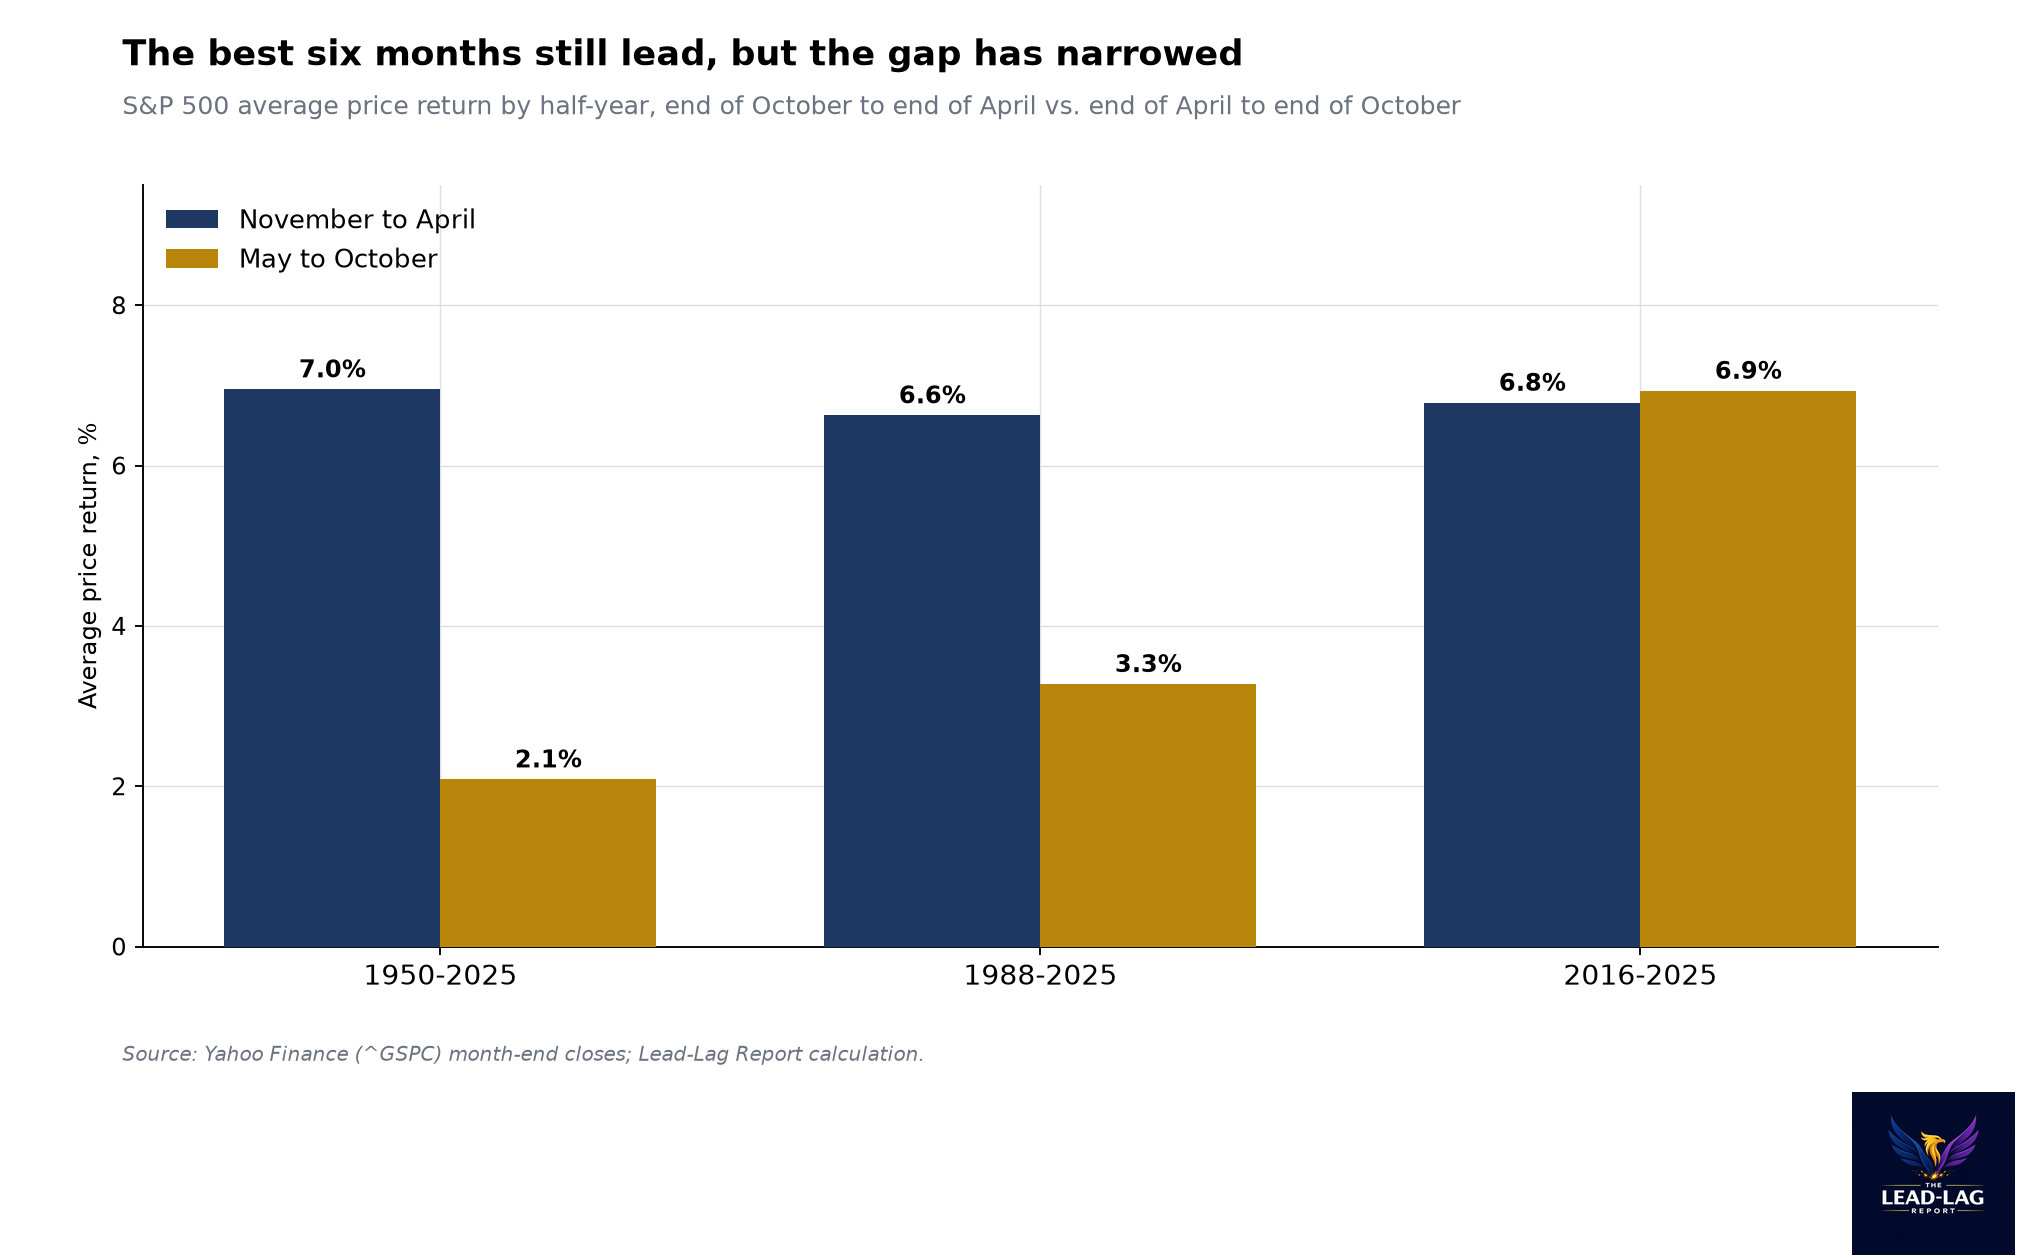
My own numbers line up. Measuring from the last close of October to the last close of April, on price alone, the S&P 500 rose in 58 of 76 periods from 1950 to 2025, with an average gain of 7.0% and a median gain of 6.2%.1 From the end of April to the end of October, it rose in 50 of 76 periods, with an average gain of 2.1%.1 Another recent count, using the same method, found the same 58 of 76.8
This year the S&P 500 enters the stretch at 7,580.07, down 0.9% in October.1 The six months that just ended, from April 30 to October 30, gained 5.1%, which is more than the long-run average for that half of the year.1 My view is that the setup for the next six months is better than average because of the election calendar, and less comfortable than average because of the Fed. Both parts of that sentence matter.
The Pattern Has Weakened, But Not Disappeared
Seasonal patterns deserve skepticism. Once a pattern is widely known, investors try to get ahead of it, and the edge shrinks. Hirsch himself wrote in the 2026 edition of the Almanac that "anticipators, shifts in cultural behavior and faster information flow have altered seasonality in recent years."2
The numbers bear that out. Since 1988, the November to April stretch has averaged 6.6%, against 3.3% for May to October.1 That gap is about half what it was before the pattern became popular. Over the 10 years from 2016 to 2025, the two halves were essentially even, at 6.8% and 6.9%.1 Yahoo Finance reached a similar conclusion, noting that over the past decade the two halves have been dead even and that May to October came out ahead in five of those years.2
So I would not treat the calendar alone as a reason to expect strong returns. The more useful question is what else is going on when the period starts. Two conditions stand out this year: the midterm election and a Fed that is still raising rates.
The Midterm Effect Is The Strongest Part
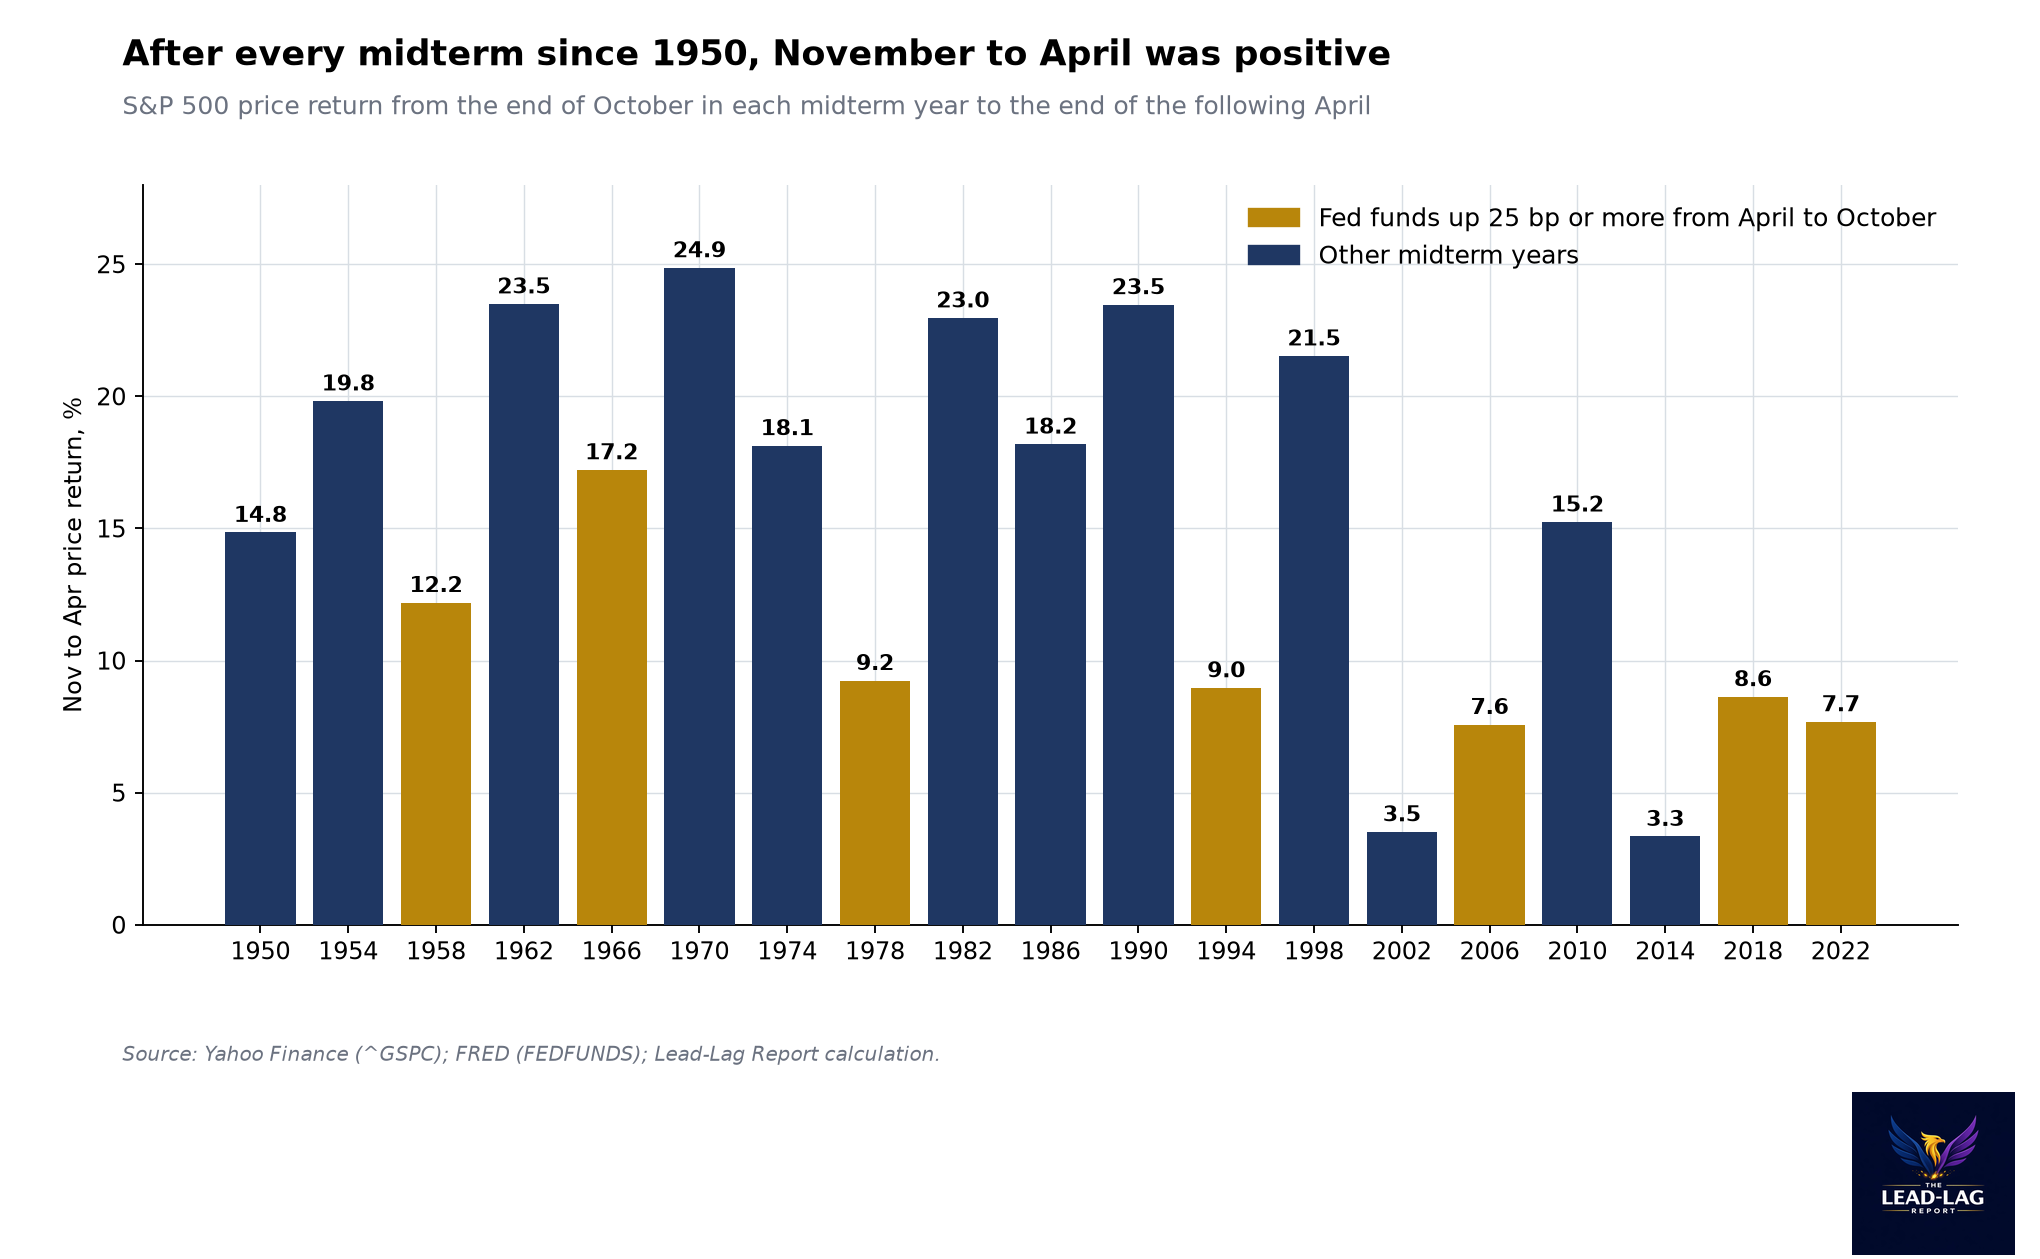
The November to April stretch after a midterm election has been positive in all 19 cases since 1950.1, 2 The average gain was 14.8%, roughly double the average across all years. The smallest gain was 3.3%, in the period that began in October 2014, and the next smallest was 3.5%, in the period that began in October 2002, near the end of a bear market.1
The largest gains came in the periods starting in 1970 at 24.9%, in 1962 and 1990 at 23.5% each, and in 1982 at 23.0%.1 Several of those came right after a bear market had ended, which is part of the story. Midterm years have a habit of including a midyear low, and the following six months often look like a recovery.
The usual explanation is political. After a midterm, the policy outlook becomes clearer, the party in power has two years to the next presidential race, and fiscal policy tends to lean toward support. Jeffrey Hirsch calls the stretch from the fourth quarter of the midterm year through the second quarter of the year before the next presidential election the best three quarters of the four-year cycle.2 Whatever the cause, 19 for 19 is a strong record. It is also a small sample, and a perfect record says more about the past than about any single future year.
What A Hiking Fed Does To The Pattern
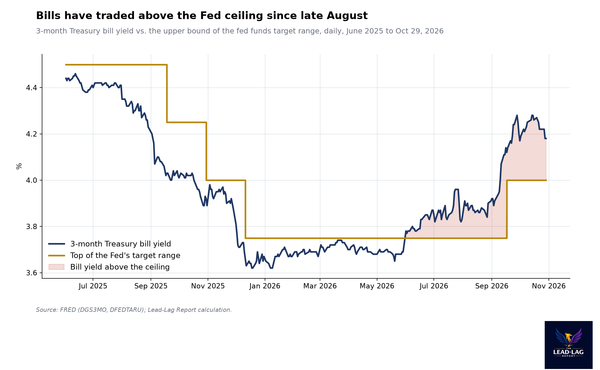
The Fed is the part of the setup that worries me. The Federal Reserve raised its target range by a quarter point to 3.75% to 4% on September 17, then held on October 28, with two officials preferring another hike.6, 9 Traders were pricing about a 75% chance of a December hike as of October 30, according to CME FedWatch as reported by Reuters.7
To test what a hiking Fed does to the pattern, I split the years since 1955 by whether the effective fed funds rate rose at least 25 basis points from April to October, the six months before each period started.1, 5 Using that test, 28 years qualify as hiking years and 43 do not. The 2026 data for October is not yet out, but with the target range raised in September, this year falls in the hiking group.5, 9
In the 28 hiking years, the following November to April stretch rose 21 times, a 75% hit rate, with an average gain of 4.6% and a median of 7.0%.1, 5 In the other 43 years, it rose 32 times, a 74% hit rate, with an average gain of 8.1% and a median of 5.4%.1, 5 The hit rates are almost identical. The difference is in the bad outcomes. The hiking group includes some of the worst periods in the sample: the stretch starting in October 1973 fell 16.6%, and the one starting in October 2000 fell 12.6%.1
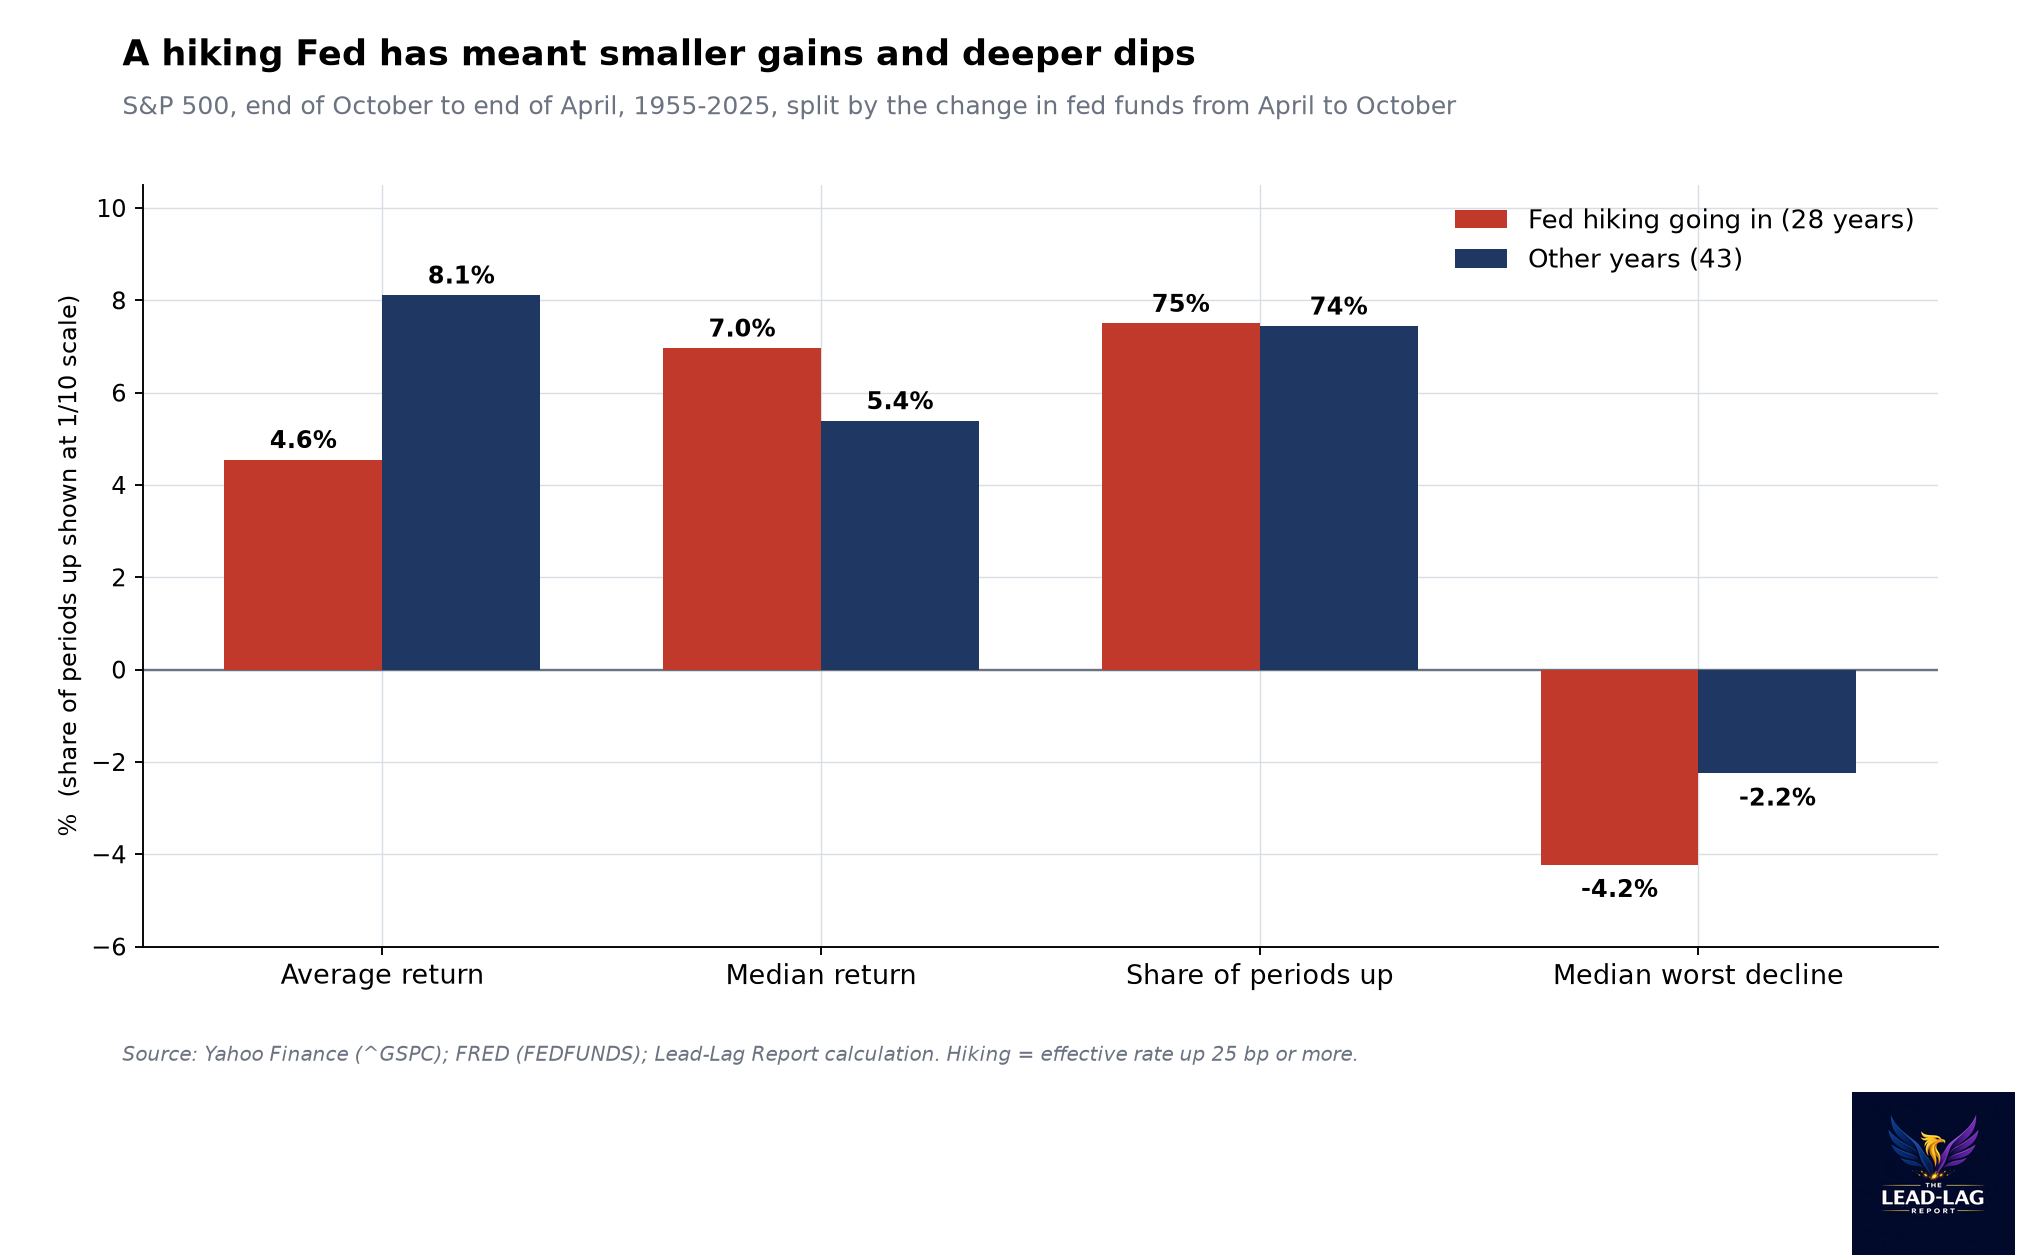
The path also gets rougher. I measured the lowest close in each November to April window, relative to the October close. In hiking years, the median worst decline was 4.2%. In other years it was 2.2%.1 In other words, the average investor in a hiking year had to sit through a larger drawdown along the way, even when the period ended higher.
When Both Conditions Are Present
Seven midterm years since 1955 also had a Fed that raised rates by at least 25 basis points in the six months before: 1958, 1966, 1978, 1994, 2006, 2018 and 2022.1, 5 The November to April stretch was positive in all seven, with gains ranging from 7.6% in the period starting in 2006 to 17.2% in the period starting in 1966. The average was 10.2%.1
That is a better record than the hiking years as a whole, which says the election calendar has tended to outweigh the Fed. But one case stands out as a warning. The stretch that began in October 2018 ended 8.6% higher, and along the way the S&P 500 fell 13.3% below its October close, in December 2018, as the Fed raised rates again and markets priced a policy mistake.1, 5 The end point was fine. The middle was painful.
That is the version I think is most relevant for 2026. The Fed has just hiked, it is signaling it may hike again, and the market is already dealing with a sharp selloff in technology stocks. A 2018 path, where the six months end higher after a meaningful drawdown, looks more plausible to me than a smooth rally.
A Weak October Is Not A Bad Sign
Some investors read a down October as a warning. The data does not support that. In the 31 years since 1950 when the S&P 500 fell in October, the following November to April stretch rose in 24, or 77%, with an average gain of 8.1%.1 That is slightly better than the average for all years. October declines often clear out selling pressure, a point Hirsch has made about the October 31 fiscal year end for mutual funds.10
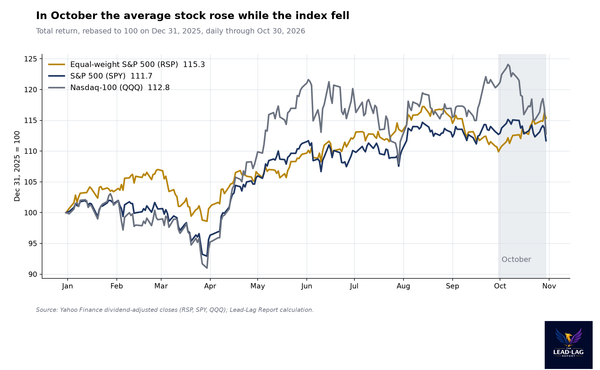
The October 2026 loss was small, 0.9%, and it came with a sharp split under the surface. The Nasdaq Composite fell 2.86% on October 30 alone, as chip stocks fell 7.2% after results from Intel and Amazon.11 For the seasonal pattern, the headline number is what counts, and a small October loss is a normal starting point.
What This Means For Investors
The main point is about expectations, not timing. The calendar argues that the next six months have favorable odds, and the midterm record makes that argument stronger. The Fed argues that the path is likely to be bumpier than average, with a larger drawdown along the way. For an investor who already owns stocks, that combination says to plan for volatility, not to expect a straight line.
For income-focused investors, the hiking backdrop matters more than the calendar. Short-term yields are above the Fed's ceiling, and the front end of the curve pays more than it has in years.9 If the Fed hikes in December, cash and short-term bonds reset higher. The seasonal pattern does nothing to change that, and the income available at the front end of the curve gives investors a reason not to stretch for returns in the riskiest parts of the stock market.
I would also keep in mind that seasonal averages describe the index, not any one sector. The stocks that led the market for most of 2026 are the ones under the most pressure now. A favorable season for the S&P 500 can still be a difficult one for its most crowded parts.
The Case Against Me
The strongest argument against my caution is the record itself. The November to April stretch after a midterm has never been negative since 1950, and it has been positive in every midterm year with a hiking Fed in my sample.1 If that pattern holds again, my concern about the Fed will look misplaced.
The second argument is that the hiking split is noisy. The two groups have nearly the same hit rate, 75% and 74%, and the hiking group actually has the higher median gain, 7.0% against 5.4%.1 The lower average comes from a handful of very bad years. If 2026 is not one of those years, the Fed may not matter much.
The third argument is that the summer half of 2026 already did well, up 5.1%, and strong years tend to stay strong.1 Momentum can carry into the winter months.
What Would Change My View
I am watching three things. First, if the Fed signals at or before its December meeting that it is done raising rates, the main source of my concern goes away, and the midterm pattern looks more reliable.6, 7
Second, if the S&P 500 falls more than 5% below its October 30 close of 7,580.07 by mid-December, the 2018 path becomes the base case. That would be a closing level of about 7,201.1
Third, if the selloff in chip stocks spreads into the broader index, the drawdown risk rises. So far the S&P 500 has held up far better than the semiconductor group.1, 11
How This Fits What I Have Written
This piece connects to two recent Macro Observations. "Defensives Beat the S&P 500 by 8% in a Month. Eleven of 15 Times, a Drawdown Followed." argued that the market's defensive rotation pointed to a drawdown ahead, which fits the rougher path a hiking Fed has tended to bring during this season.12 "The Fed Is Hiking Into a Credit Boom. Business Loans Are Up 10%." explained why the Fed has room to keep tightening, which is the main risk to the seasonal pattern this year.13
The Takeaway
The best six months of the stock market year started on Monday, and the midterm calendar has a perfect record over the 19 cycles since 1950.1, 2 That is a strong tailwind. The Fed is the headwind. In hiking years, the average November to April gain has been about half of what it was in other years, and the median drawdown along the way has been about twice as deep.1, 5 My read is that the odds favor a higher S&P 500 by the end of April, with a meaningful pullback first. That is the 2018 template, and it is the one I would plan around.
Annual paying members get a free print copy of The Price of a Quiet Yen or Intermarket Analysis and Investing, Third Edition (retail value up to $44.95, U.S. shipping): leadlagreport.com/annual. If you have read either book, an honest Amazon review helps other readers find it: The Price of a Quiet Yen and Intermarket Analysis and Investing.
Notes
- [1] S&P 500 (^GSPC) daily and month-end closes, 1950 to Oct 30, 2026, price only, via Yahoo Finance. Seasonal returns, midterm splits, hiking-year splits and drawdowns are Lead-Lag Report calculations: finance.yahoo.com/quote/%5EGSPC/history/
- [2] Yahoo Finance, "The stock market's best 6 months of the year start Monday: Chart of the Day," October 30, 2026 (Hirsch quotes, midterm record): finance.yahoo.com/markets/article/the-stock-markets-best-6-months-of-the-year-start-monday-chart-of-the-day-100000806.html
- [3] Stock Trader's Almanac, "Our Strategy": www.stocktradersalmanac.com/strategy.aspx
- [4] Fidelity, "Best 6 months for stocks": www.fidelity.com/learning-center/trading-investing/best-6-months
- [5] Board of Governors of the Federal Reserve System, Federal Funds Effective Rate (FEDFUNDS), monthly, via FRED: fred.stlouisfed.org/series/FEDFUNDS
- [6] Federal Reserve FOMC statement, October 28, 2026: www.federalreserve.gov/newsevents/pressreleases/monetary20261028a.htm
- [7] Reuters via Hurriyet Daily News, "Rising oil prices and inflation weigh on gold," October 30, 2026 (about 75% chance of a December rate increase per CME FedWatch): www.hurriyetdailynews.com/rising-oil-prices-and-inflation-weigh-on-gold-228794
- [8] The Motley Fool via Yahoo Finance, "History Says the Stock Market's Best 6 Months Start Nov. 1. Here's How Often They've Paid Off Since 1950.," October 2026: finance.yahoo.com/markets/stocks/articles/history-says-stock-markets-best-223902581.html
- [9] Board of Governors of the Federal Reserve System, Federal Funds Target Range, Upper Limit (DFEDTARU), and Market Yield on U.S. Treasury Securities at 3-Month Constant Maturity (DGS3MO), via FRED: fred.stlouisfed.org/series/DFEDTARU
- [10] Yahoo Finance, "Why November kicks off Wall Street's hottest stretch of the year," interview with Jeffrey Hirsch, October 30, 2026: finance.yahoo.com/video/why-november-kicks-off-wall-streets-hottest-stretch-of-the-year-202801238.html
- [11] Reuters via The Charlotte Observer, "Wall Street closes sharply lower as AI cash burn fears spark tech selloff," October 30, 2026: www.charlotteobserver.com/news/nation-world/national/article317845088.html
- [12] The Lead-Lag Report, "Defensives Beat the S&P 500 by 8% in a Month. Eleven of 15 Times, a Drawdown Followed.": www.leadlagreport.com/defensives-beat-the-s-p-500-by-8-in-a-month-eleven-of-15-times-a-drawdown-followed/
- [13] The Lead-Lag Report, "The Fed Is Hiking Into a Credit Boom. Business Loans Are Up 10%.": www.leadlagreport.com/the-fed-is-hiking-into-a-credit-boom-business-loans-are-up-10/