Workers Kept 53% of Business Output Last Quarter. That Is the Lowest Since 1947.
Productivity rose 3.6% and labor costs fell in the third quarter, while the labor share of output hit 53.0%, the lowest on record.

Free for advisors today: Monthly Group Meetings

A seat at the table every month. Access to the monthly advisor group meetings: shared learning, peer insight and community, with a prep brief and discussion questions to get more out of each session.
What you receive
- Access and participation summary
- Meeting-prep brief
- Suggested discussion questions
- Contribution idea
- Peer-fit notes
- Follow-up preference checklist
Cost in credits: 1 for access. Turnaround: Recurring monthly access. Delivered as: Handled with the Community Desk. Best for: Advisors who want a consistent peer community.
It is free for advisors. There is no invoice from us. You earn the credits by showing up: attend a sponsored Lead-Lag Media webinar, meet a fund issuer in a one-on-one introduction, or join one of our advisor dinners.
Prefer to browse first? See all 34 services at advisor.leadlagmedia.com.
Credits carry no cash value and are not payment for services. Drafts are prepared with AI assistance and are for your and your firm’s review before use; they are not investment, legal, tax or compliance advice, and nothing is guaranteed. Services are offered to financial advisors and are not a solicitation to retail investors.
American businesses got more out of every hour of work last quarter than they have in a while, and workers kept the smallest share of that output since record keeping began.
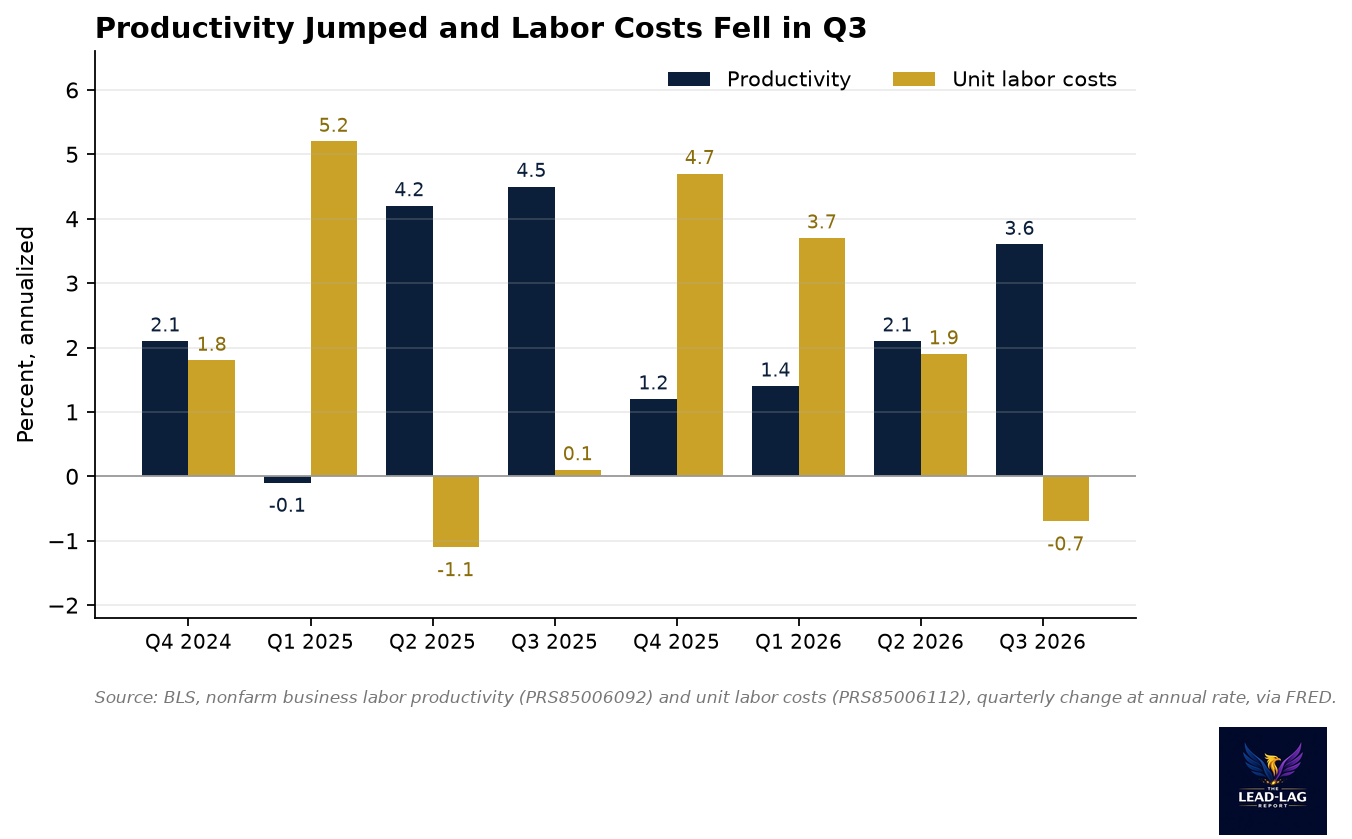
Nonfarm business productivity rose at a 3.6% annual rate in the third quarter of 2026, the Bureau of Labor Statistics reported on Thursday. Output grew 3.7% while hours worked grew just 0.1%.[1] Unit labor costs, the cost of the labor that goes into each unit of output, fell at a 0.7% rate, the first decline since the second quarter of 2025.[1][2]
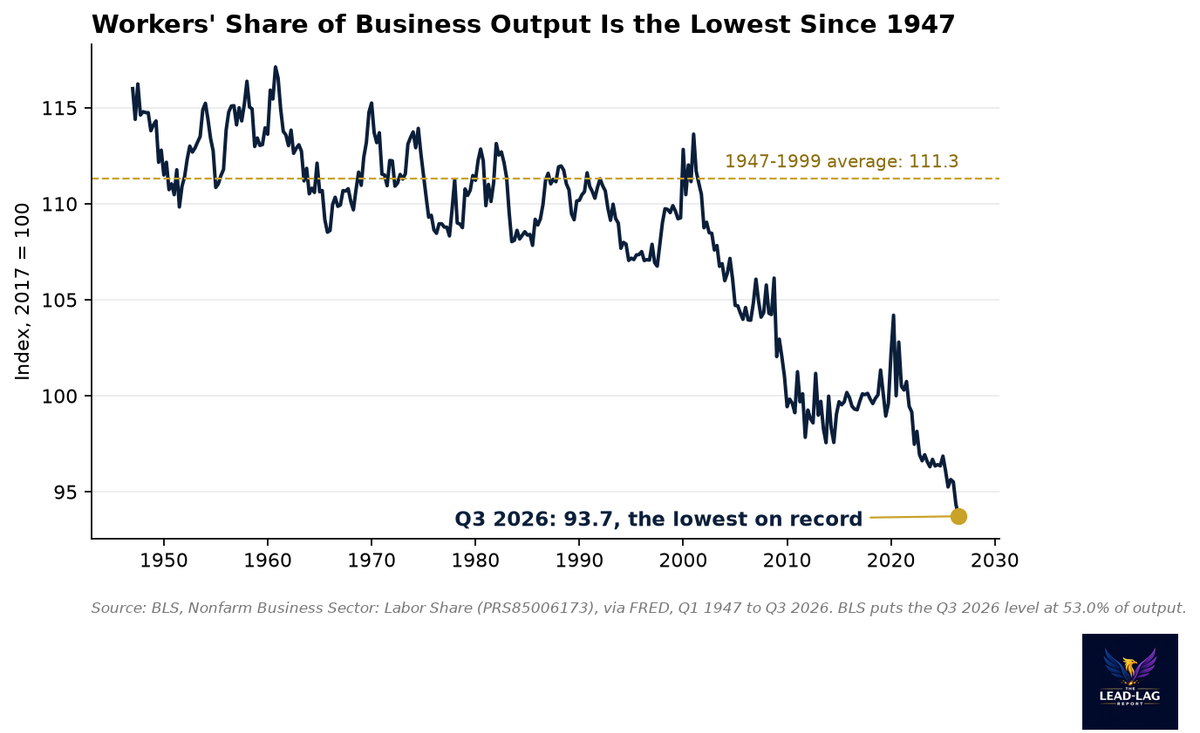
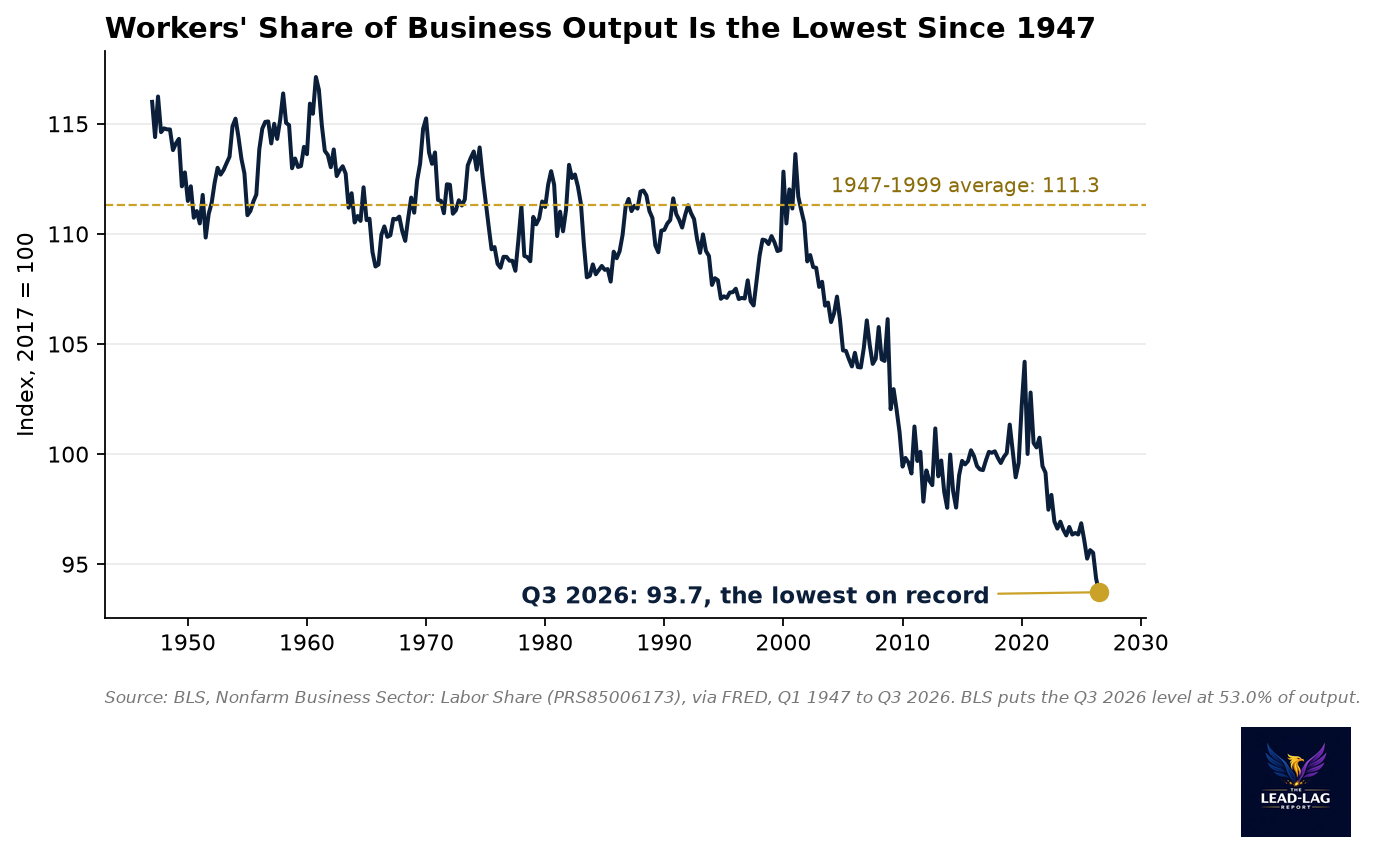
The same release carried a line that got less attention. The labor share, the portion of business output paid to workers as compensation, was 53.0% in the third quarter. That is the lowest level in a series that begins in 1947.[1]
Two stories in one release
The first story is the one the market heard. Productivity has now grown at a 2.2% annual rate since the fourth quarter of 2019, according to the BLS. The previous business cycle, from late 2007 to late 2019, managed 1.5%. The current pace matches the long-run average since 1947.[1] Faster productivity lets companies pay more without raising prices, which is why the Reuters account of the report framed it as evidence that the labor market is not a source of inflation.[2]
The quarterly detail supports that read. Hourly compensation rose at a 2.9% rate in the quarter. Productivity rose faster, so the labor cost of each unit of output went down.[1] Over the past four quarters, unit labor costs are up 2.4%, with hourly compensation up 4.5% and productivity up 2.1%.[1] The second quarter was also revised up, to 2.1% productivity growth from 1.4% in the first quarter.[1][3]
The second story is about who keeps the gains. A 53.0% labor share means workers received a little over half of the value their businesses produced in the quarter. The rest went to profits, interest, depreciation and other non-labor income. On the BLS index, where 2017 equals 100, the labor share stands at 93.7. It was 99.6 at the end of 2019, and it averaged 111.3 from 1947 through 1999.[4]
Output per hour versus pay per hour
The cleanest way to see the split is to put output per hour next to what an hour of work buys. Since the fourth quarter of 2019, output per hour in the nonfarm business sector is up 16.0%. Real hourly compensation, which adjusts pay and benefits for consumer prices, is up 7.3% over the same period.[5][6]
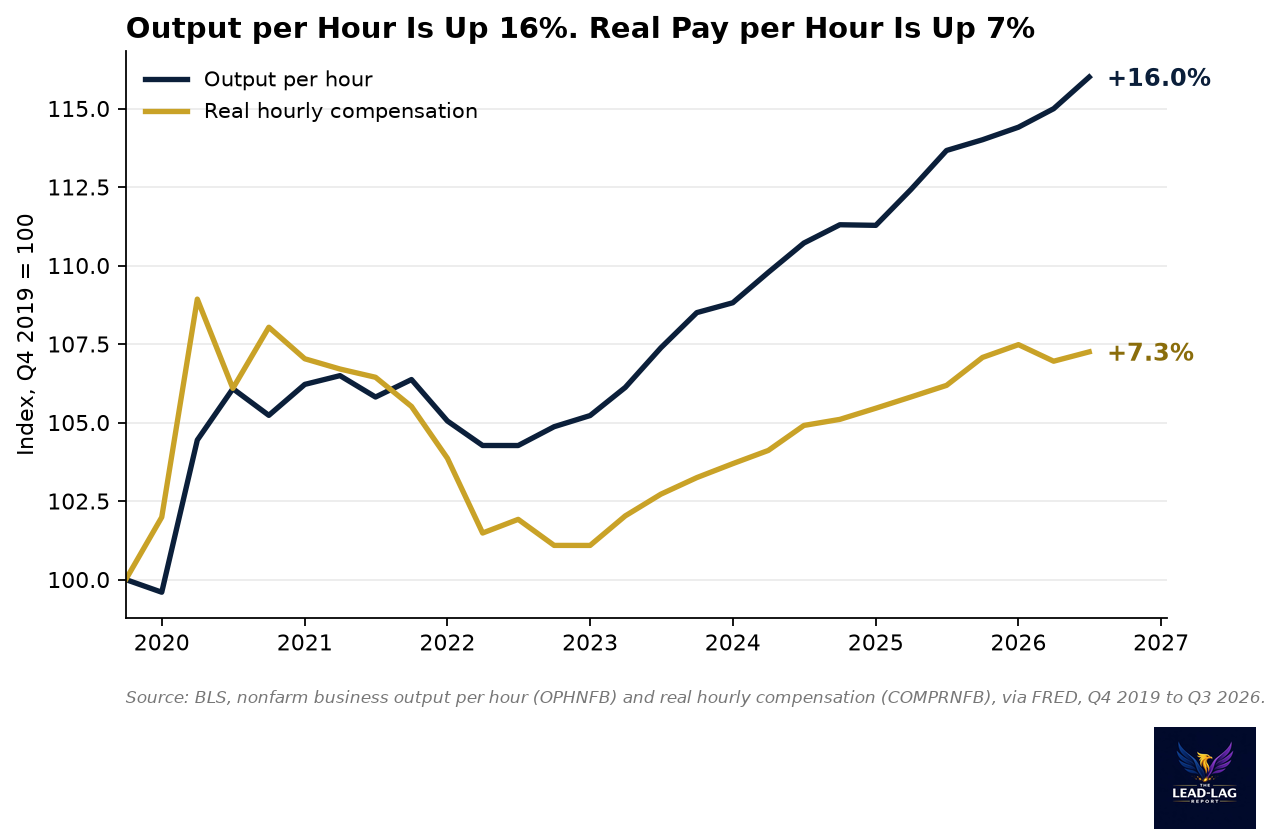
The two lines moved together until 2021. Then inflation ran ahead of wages and real pay fell for most of 2022, while productivity kept climbing from 2023 on. Real hourly compensation has recovered, rising 1.1% at an annual rate in the third quarter and 1.0% over the last four quarters, but it has not closed the gap.[1][6]
None of this is unusual in one direction. The labor share has drifted lower since about 2000, and it fell again after the pandemic spike in 2020, when lost low-wage jobs briefly pushed it up.[4] What is new is the level. Every prior low in the series sits above where it is now.[1][4]
Why it matters for portfolios
For corporate margins, the combination is close to ideal. When output rises 3.7% and hours rise 0.1%, the extra revenue arrives without much extra labor cost. Falling unit labor costs leave room for profit margins to stay wide even if pricing power fades.[1]
For the Federal Reserve, the report removes one worry. Policymakers watch unit labor costs as a gauge of wage-driven inflation pressure, and a decline in that measure is hard to square with a labor market that is pushing prices higher.[1][2]
For consumers, the picture is less comfortable. Spending depends on income, and a record low labor share means a smaller slice of each dollar of output reaches paychecks. Real compensation growing about 1% a year is enough to keep spending moving. It is not enough to support a spending boom.[1]
Manufacturing did not share in the quarter. Factory productivity rose just 0.3%, and manufacturing unit labor costs climbed 2.7% at an annual rate and 4.0% from a year earlier.[1] The nonfarm business sector grew productivity at more than ten times the factory pace, so most of the quarter's gain came from outside manufacturing.[1]
For advisors, the split is a useful frame for client conversations. A client who owns a diversified stock portfolio is on the side of the ledger that has been collecting the productivity gains. A client whose household depends mostly on wage income has seen real pay rise 7.3% since late 2019, less than half the gain in output per hour.[5][6] Both experiences are true at once, which helps explain why strong economic data and weak consumer mood can sit side by side.
What to watch
These are preliminary numbers. The BLS will publish revised third-quarter figures on December 8, 2026, and productivity estimates often move by several tenths of a point between releases.[1][7] The second quarter was revised up 0.7 point in this report alone.[1]
The question for the next few quarters is whether the gains in output per hour start to show up in pay. If real compensation accelerates while productivity holds above 2%, the labor share stabilizes and consumer spending has more support. If productivity keeps rising while real pay grows near 1%, margins stay wide and the labor share keeps setting new lows. One quarter does not settle which path we are on. It does show that, for now, the gains are going to the owners of capital first.
Notes
[1] U.S. Bureau of Labor Statistics, Productivity and Costs, Third Quarter 2026, Preliminary (USDL 26-1631), Nov. 5, 2026: https://www.bls.gov/news.release/archives/prod2_11052026.htm. Productivity +3.6%, output +3.7%, hours +0.1%, hourly compensation +2.9%, real hourly compensation +1.1%, unit labor costs -0.7% (annualized); four-quarter changes: productivity +2.1%, hourly compensation +4.5%, real hourly compensation +1.0%, unit labor costs +2.4%; labor share 53.0%; 2.2% cycle rate since Q4 2019 vs 1.5% for Q4 2007 to Q4 2019; manufacturing productivity +0.3%, unit labor costs +2.7% (annualized) and +4.0% (year over year); Q2 productivity revised up 0.7 point to 2.1%; revised release Dec. 8, 2026.
[2] Reuters, "US worker productivity surges in third quarter," Nov. 5, 2026: https://www.reuters.com/business/us-worker-productivity-surges-third-quarter-2026-11-05/.
[3] Nonfarm Business Sector: Labor Productivity (Output per Hour) for All Workers, percent change at annual rate, BLS via FRED, series PRS85006092: https://fred.stlouisfed.org/series/PRS85006092. 1.4 (Q1 2026), 2.1 (Q2 2026), 3.6 (Q3 2026).
[4] Nonfarm Business Sector: Labor Share for All Workers, index 2017=100, BLS via FRED, series PRS85006173: https://fred.stlouisfed.org/series/PRS85006173. 99.588 (Q4 2019), 93.729 (Q3 2026); 1947 to 1999 average 111.3; series low at Q3 2026.
[5] Nonfarm Business Sector: Labor Productivity (Output per Hour) for All Workers, index, BLS via FRED, series OPHNFB: https://fred.stlouisfed.org/series/OPHNFB. Up 16.0% from Q4 2019 to Q3 2026.
[6] Nonfarm Business Sector: Real Hourly Compensation for All Workers, index, BLS via FRED, series COMPRNFB: https://fred.stlouisfed.org/series/COMPRNFB. Up 7.3% from Q4 2019 to Q3 2026.
[7] U.S. Bureau of Labor Statistics, Schedule of Releases for Productivity and Costs: https://www.bls.gov/schedule/news_release/prod2.htm.
Paid members get the full Weekly Signals, the weekly Leaders and Laggards and every chart behind each call. Start with 7 days free.
The Lead-Lag Report is provided by Lead-Lag Publishing, LLC. All opinions and views mentioned in this report constitute our judgments as of the date of writing and are subject to change at any time. Information within this material is not intended to be used as a primary basis for investment decisions and should also not be construed as advice meeting the particular investment needs of any individual investor. Trading signals produced by the Lead-Lag Report are independent of other services provided by Lead-Lag Publishing, LLC or its affiliates, and positioning of accounts under their management may differ. Please remember that investing involves risk, including loss of principal, and past performance may not be indicative of future results. Lead-Lag Publishing, LLC, its members, officers, directors and employees expressly disclaim all liability in respect to actions taken based on any or all of the information on this writing.