The Board Turns Defensive, and a 3.7% Cushion Decides What It Means
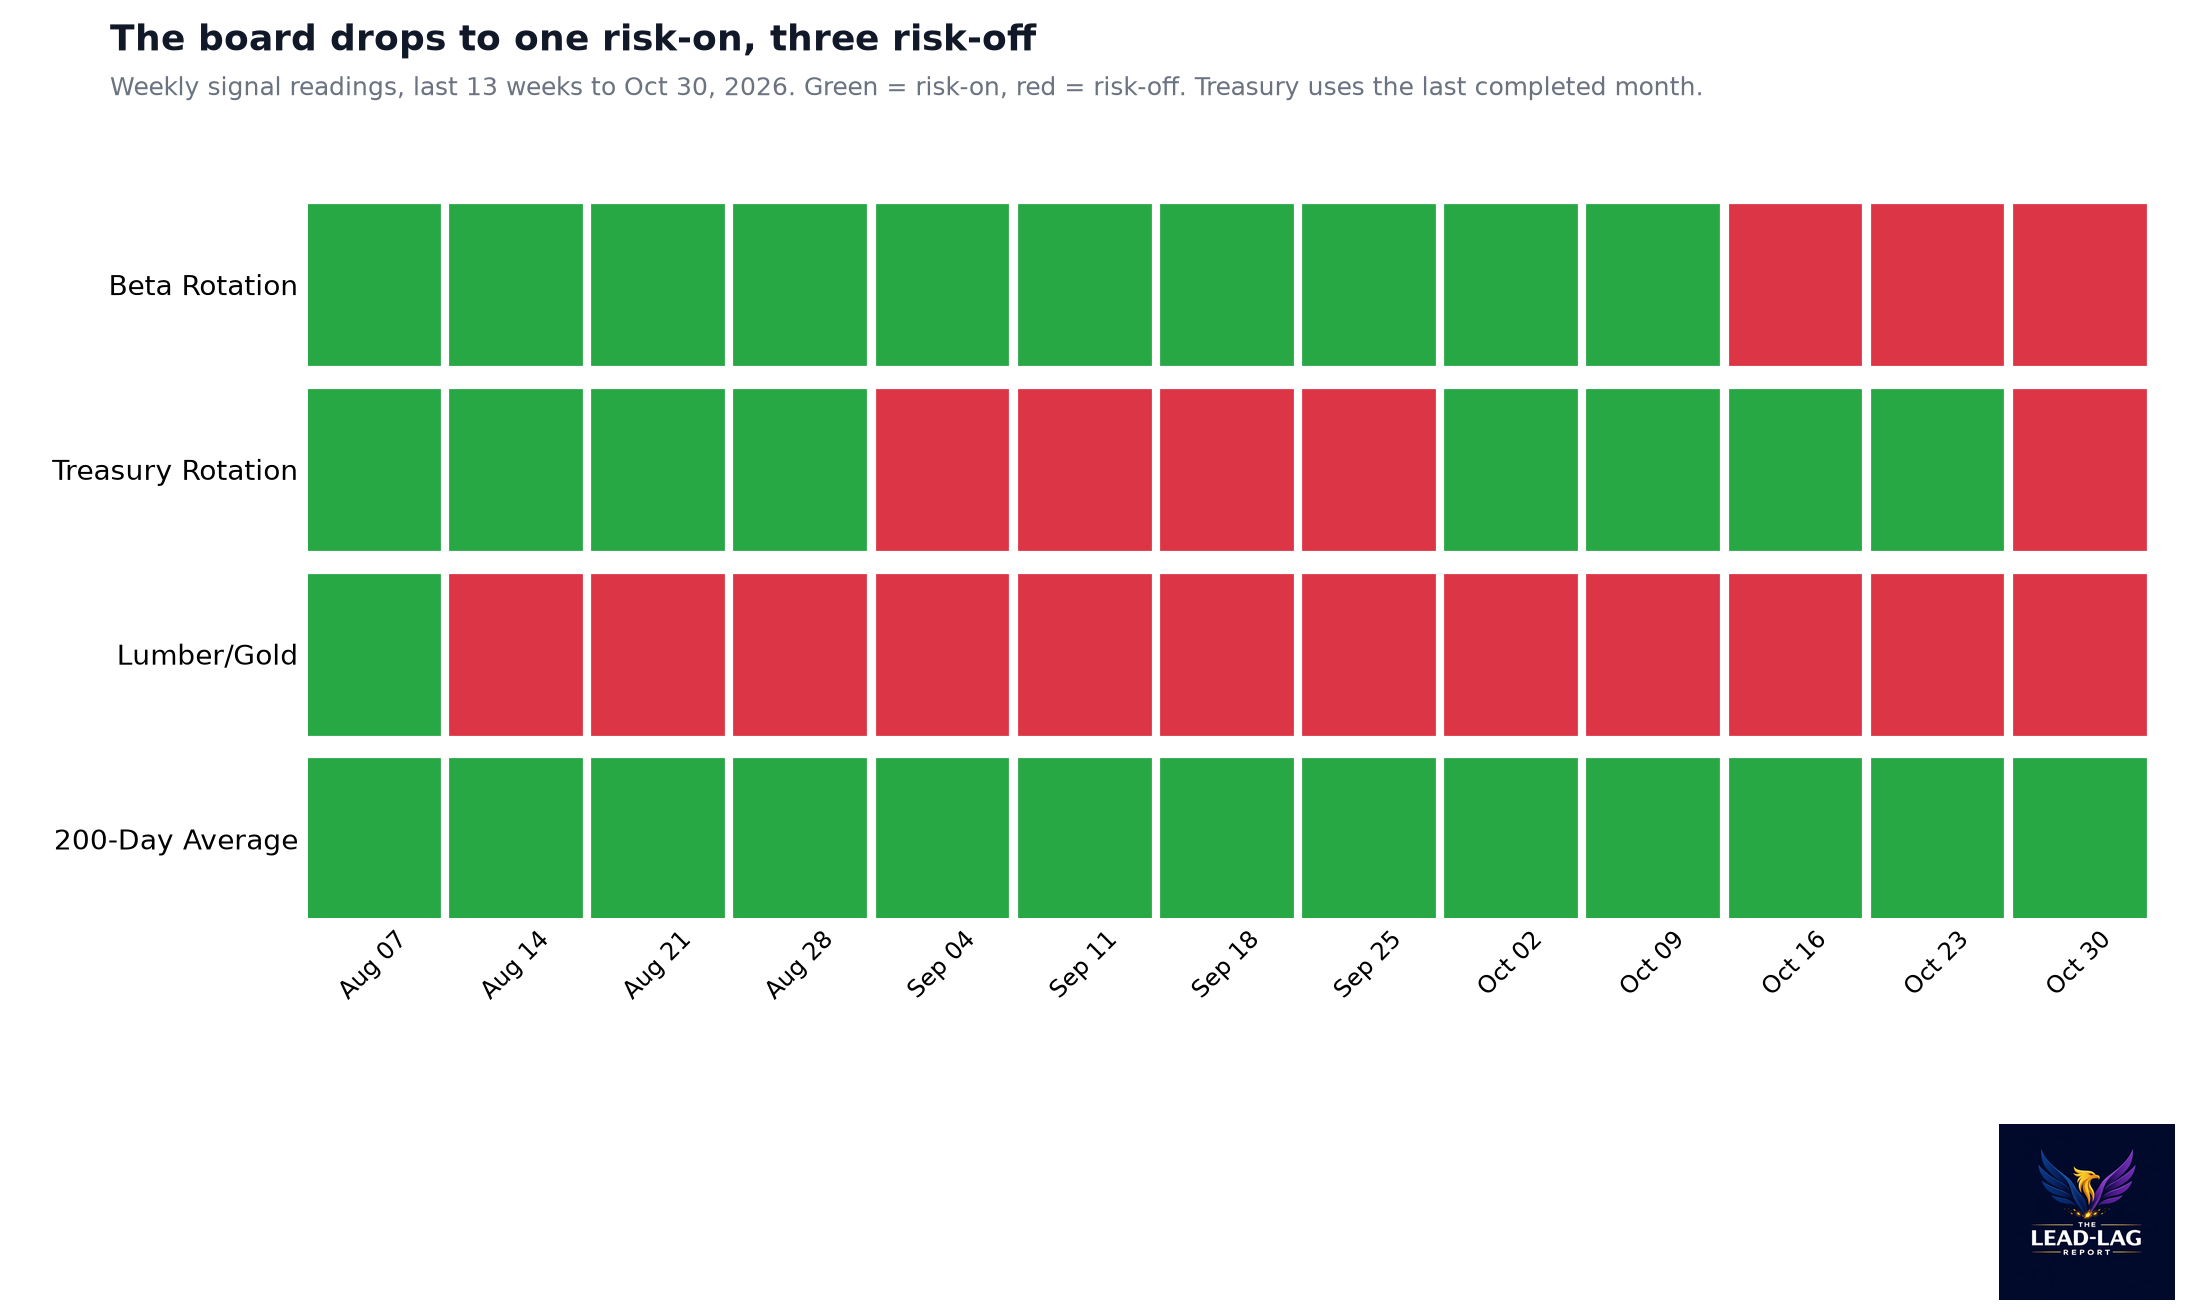
Three of four signals read risk-off for the first time since March. Since 2008, a board this defensive with the trend intact rose a quarter later 25 of 30 times.

Today's Lead-Lag Report post is sponsored by Relative Sentiment
The Relative Sentiment Tactical Allocation ETF is a flexible, multi-asset fund that invests across stocks, bonds, commodities, precious metals, and currencies. Its approach is guided by a research-based factor called relative sentiment — which tracks how optimistic or cautious professional investors are compared to individual investors. Studies show professionals tend to have an edge over time, and this ETF seeks to capture that insight by increasing exposure to areas where institutions are more optimistic and reducing exposure where they're more cautious. Relative sentiment often complements trend-following strategies, helping create portfolios that may be more balanced and less prone to sharp swings.
The Fund's investment objectives, risks, charges and expenses must be considered carefully before investing. This and other important information is contained in the Prospectus and SAI, which may be obtained by following the links or by calling +1.215.882.9983. Please read the prospectus carefully before investing.
Investments involve risk. Principal loss is possible.
The Fund is distributed by PINE Distributors LLC.
ETFAC-4976143-11/25
DISCLAIMER – PLEASE READ: This is sponsored advertising content for which Lead-Lag Publishing, LLC has been paid a fee. The information provided in the link is solely the creation of Relative Sentiment. Lead-Lag Publishing, LLC does not guarantee the accuracy or completeness of the information provided in the link or make any representation as to its quality. All statements and expressions provided in the link are the sole opinion of Relative Sentiment. and Lead-Lag Publishing, LLC expressly disclaims any responsibility for action taken in connection with the information provided in the link.
The Board Turns Defensive, and a 3.7% Cushion Decides What It Means
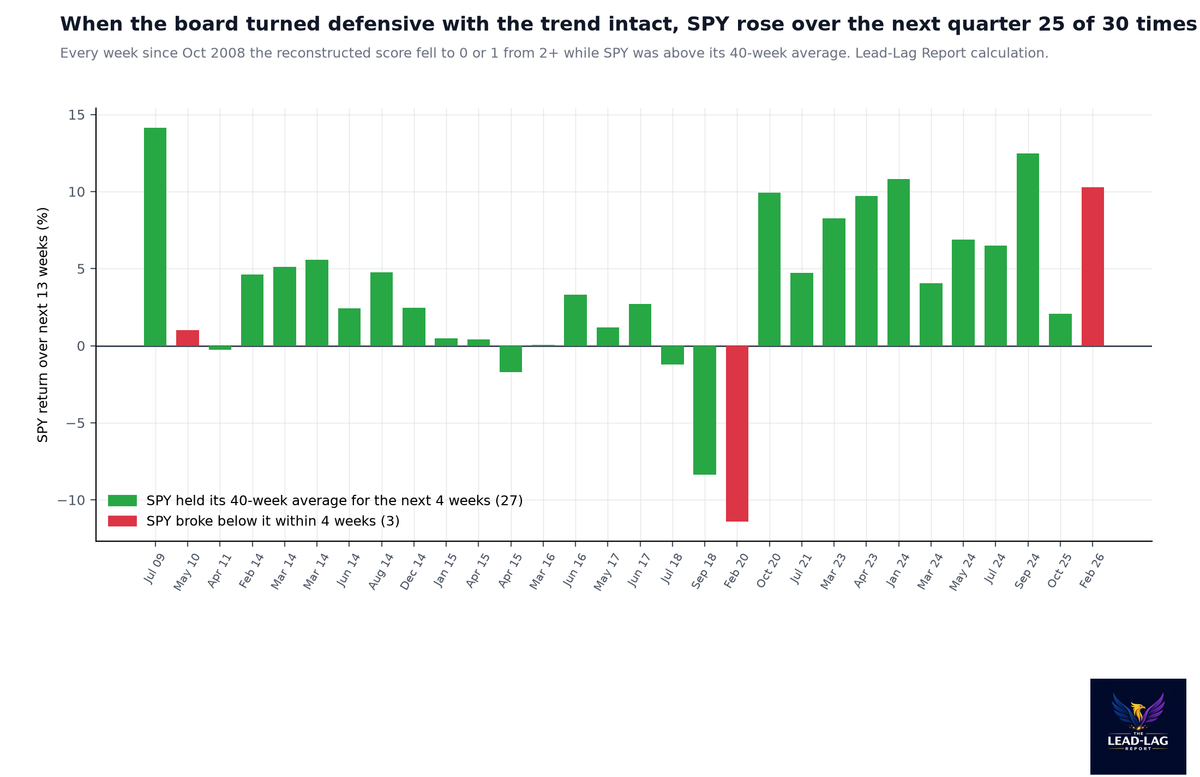
Three of four signals now read risk-off for the first time since March. Since 2008, a board this defensive with the trend still intact has been followed by a higher S&P 500 a quarter later 25 times out of 30. The three exceptions all broke the trend line within a month.
MICHAEL A. GAYED, CFA
Utilities have beaten the S&P 500 by 11.05% over four weeks, a reading higher than 99% of weekly observations since 2006, and October's bond market just turned the Treasury signal red. That puts the Weekly Signals board at one risk-on and three risk-off. My thesis is that this reading, on its own, is not a sell signal. I rebuilt the four-signal score back to 2008 and found 30 earlier weeks when it fell to one or zero while SPY was still above its long-term trend. SPY was higher 13 weeks later in 25 of them, with a median gain of 3.68%. The three cases that went badly had one thing in common: SPY broke its trend line within four weeks. That line sits near 730 today, 3.69% below Friday's close, and it is the whole call.
Key Takeaways
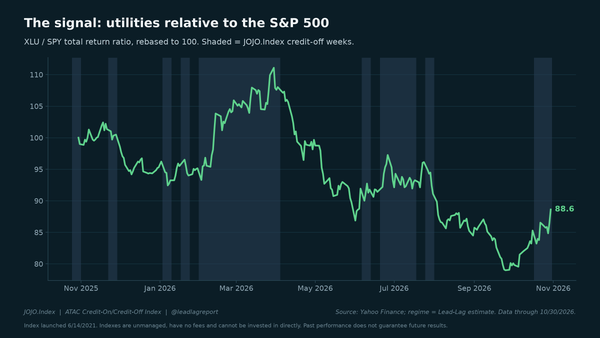
- Beta Rotation: RISK-OFF, third week. The XLU/SPY 4-week rate of change is +11.05%, up from +9.33% a week ago and -4.10% three weeks ago. Utilities gained 9.04% over four weeks while SPY lost 1.81%.
- Treasury Rotation: FLIPPED to RISK-OFF. In October, TLT returned 5.22% and IEF 2.74%. Long bonds led by 2.48 points, and that reading holds for every November edition.
- Lumber/Gold: RISK-OFF, twelfth straight week, but close to flipping for the wrong reason. Lumber is down 15.07% over 13 weeks and gold is down 4.19%, a gap of -10.87 points, about half of last week's -19.37.
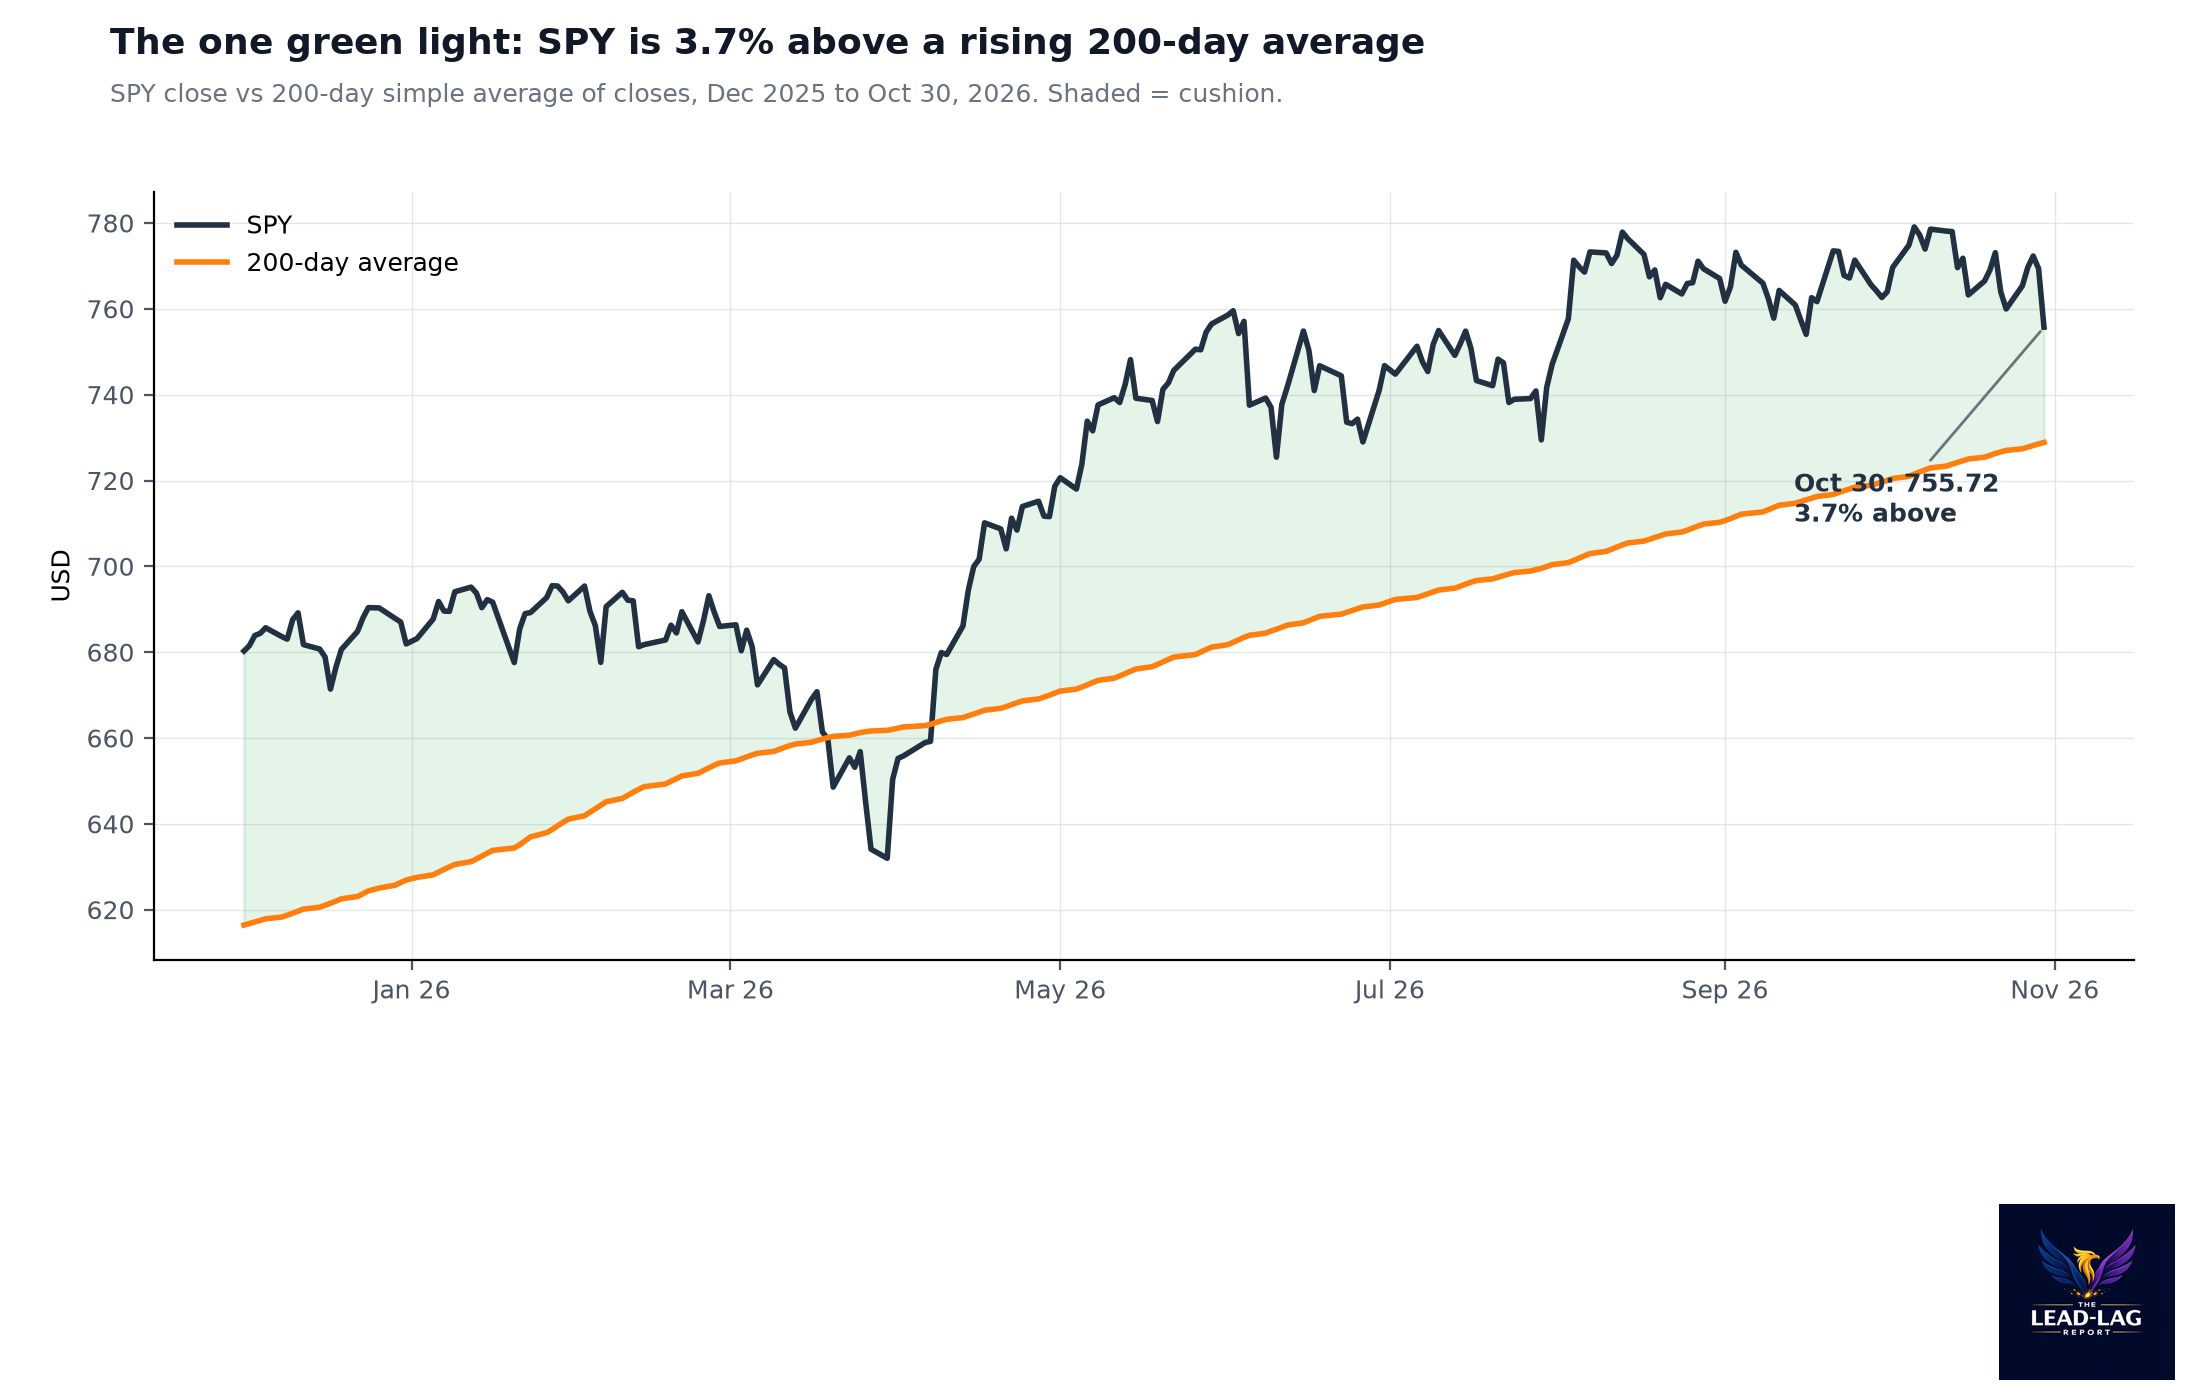
- 200-Day Average: RISK-ON. SPY closed at 755.72 against a 200-day average of 728.85, a 3.69% cushion. It has closed above the line for 144 trading days since April 7.
Update: What Moved Since Friday's Close
The four readings above are the official ones, taken at the Friday, October 30 close. Here is how Monday and Tuesday moved them, using closes through Tuesday, November 3.
- Beta Rotation still reads RISK-OFF, but the lead is shrinking. SPY slipped 0.18% from Friday to 754.35 and XLU 0.02% to 43.42. Measured over the four weeks to Tuesday, from the October 6 close, the XLU/SPY change is +8.95%, down from +11.05% on Friday but still well above zero.
- Treasury Rotation stays RISK-OFF on October's data. November is running the other way so far: TLT is down 0.89% and IEF 0.65% month to date, a spread of -0.24 points. That only counts once the month is complete, so the official reading does not change until early December.
- Lumber/Gold is on the edge of a flip. Lumber closed at 525.5 and gold at 3,930.32. Friday's 13-week window will start from the August 7 closes, when gold was at 4,341.94. On Tuesday's prices, lumber is down 9.24% and gold 9.48% against those anchors, a gap of +0.24 points. If that holds to Friday, the signal flips to RISK-ON for the first time since August 14.
- The 200-day cushion narrowed a little. SPY closed at 754.35 against a 200-day average of 729.47, a cushion of 3.41%, from 3.69% on Friday. If SPY stayed flat, the average would be about 730.52 by Friday's close.
- Credit widened on Friday, then eased. The high-yield spread jumped to 3.44% on October 30 from 3.26% the day before, then eased to 3.40% on November 3. That is 0.10 points from the 3.50% falsifier below. The CCC and lower spread was 13.16% on November 3. High beta (SPHB) fell 0.29% from Friday's close.
Two days do not change a Friday signal. The board is still one risk-on and three risk-off, but Friday could bring it back to two and two if lumber holds its ground against gold.
The Week in Brief
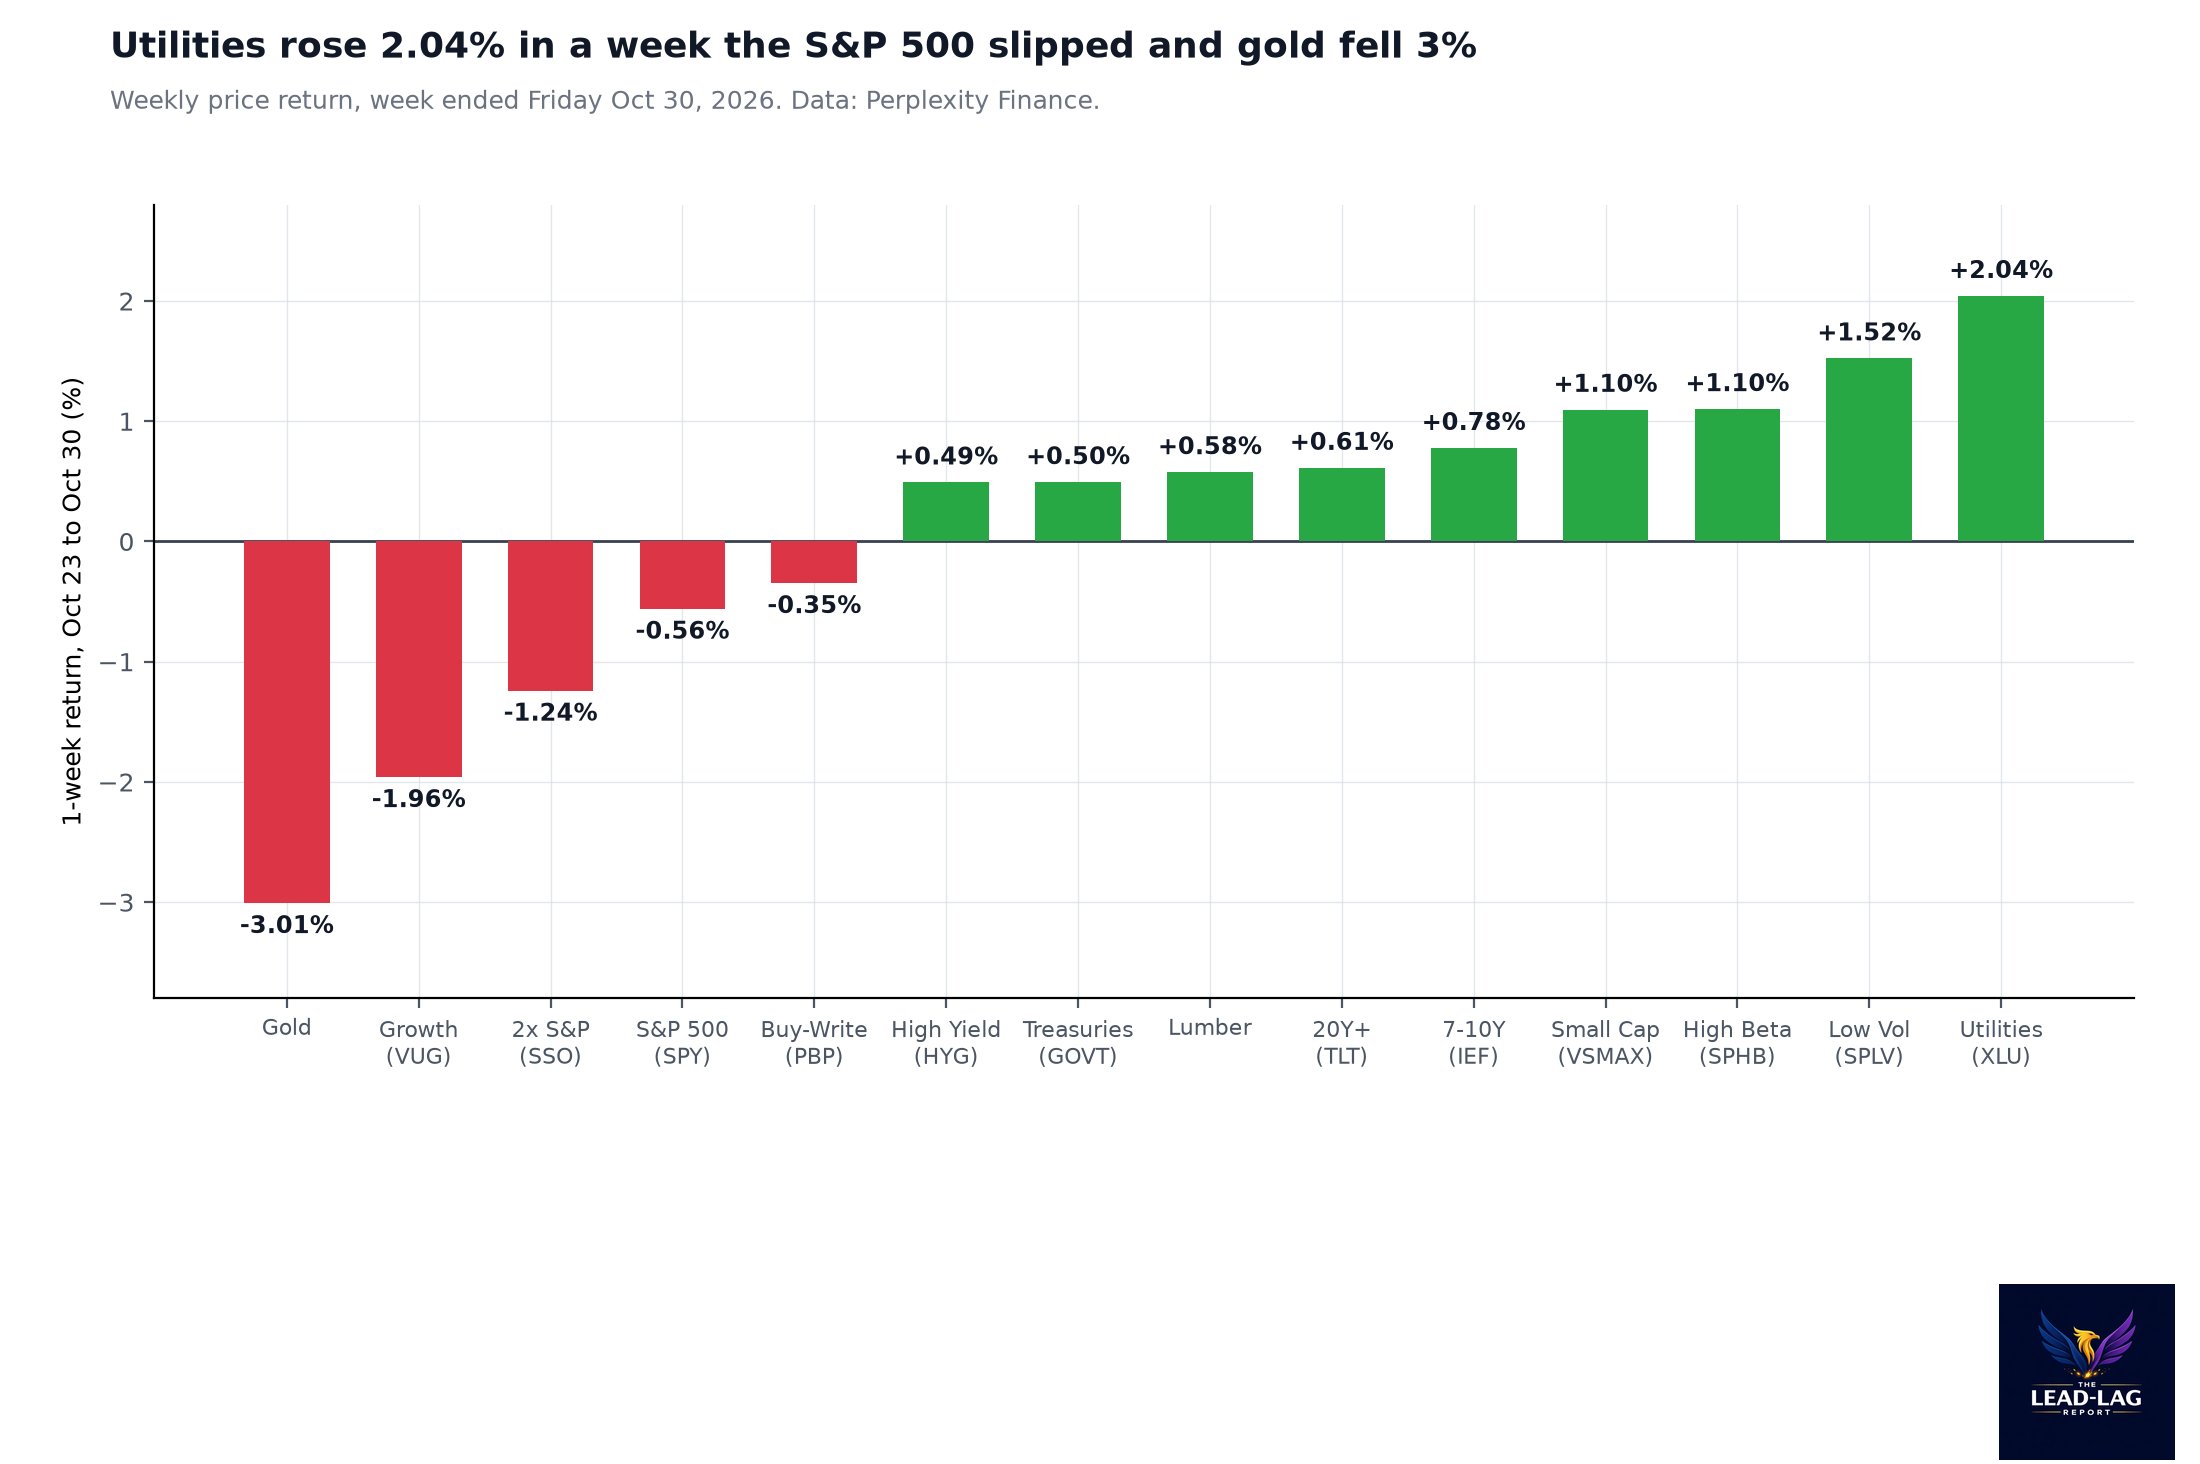
SPY fell 0.56% for the week ended October 30, closing at 755.72. It spent most of the week rising, to 772.31 on Wednesday, then gave it all back on Friday with a 1.77% drop. Friday was a high-beta selloff in one session: SPHB fell 4.86%, from 144.53 to 137.50, and growth (VUG) fell 3.00%. Utilities rose 0.67% that same day.
For the full week, utilities (XLU) gained 2.04%, low volatility (SPLV) 1.52% and small caps (VSMAX) 1.10%. High beta finished up 1.10% despite Friday because it had rallied hard earlier in the week. Bonds gained across the curve: IEF 0.78%, TLT 0.61% and the broad Treasury fund (GOVT) 0.50%. High yield (HYG) rose 0.49%. On the losing side were gold, down 3.01% to 3,875.64, growth at -1.96%, the 2x S&P fund (SSO) at -1.24% and the buy-write fund (PBP) at -0.35%. VIX closed at 19.42, up from 16.91 on Wednesday.
October as a whole was stark. XLU rose 10.12% and SPLV 8.59% for the month while SPY lost 0.91%, SPHB lost 8.78% and VUG lost 5.60%. SPHB is now 12.29% below its October 6 close, while SPY is 3.00% below its October 6 high of 779.09. The index has given up very little. Its riskiest stocks have given up a lot.
What My October 23 Reading Said, and What Happened
The last published edition, A Market Divided on September 29, read the board two to two. My reading on the October 23 close kept it two to two, and the thesis was that a 98th-percentile utility surge pointed to a rough month, not a lost quarter. It made one mechanical call and set three dated markers.
The mechanical call was that Treasury Rotation would read RISK-OFF in this edition if October's TLT-minus-IEF gap stayed above zero. It finished at +2.48 points, so that call was right. The first marker was a high-yield spread at or above 3.50% at the October 30 close. It was 3.40% on October 22 and then narrowed to 3.26% on October 29, the latest FRED print. Not hit. The second was SPY below about 728.7 at the October 30 close, where I projected the 200-day average would sit. The average landed at 728.85, close to the projection, and SPY closed at 755.72. Not hit. The third, SPY below 739.8 at the November 20 close, is still open. SPY is 2.10% above it.
The "rough month" part is tracking, slowly. SPY is down 0.56% in the first week of that month. The part of last week's read I want to correct is emphasis. I leaned on credit as the line that would turn me more defensive, and credit moved away from that line while utilities kept running. That makes credit look less like the trigger and more like a dissent, which matters for the section below on how the signals disagree.
Signal 1: Beta Rotation (XLU/SPY 4-Week Rate of Change)
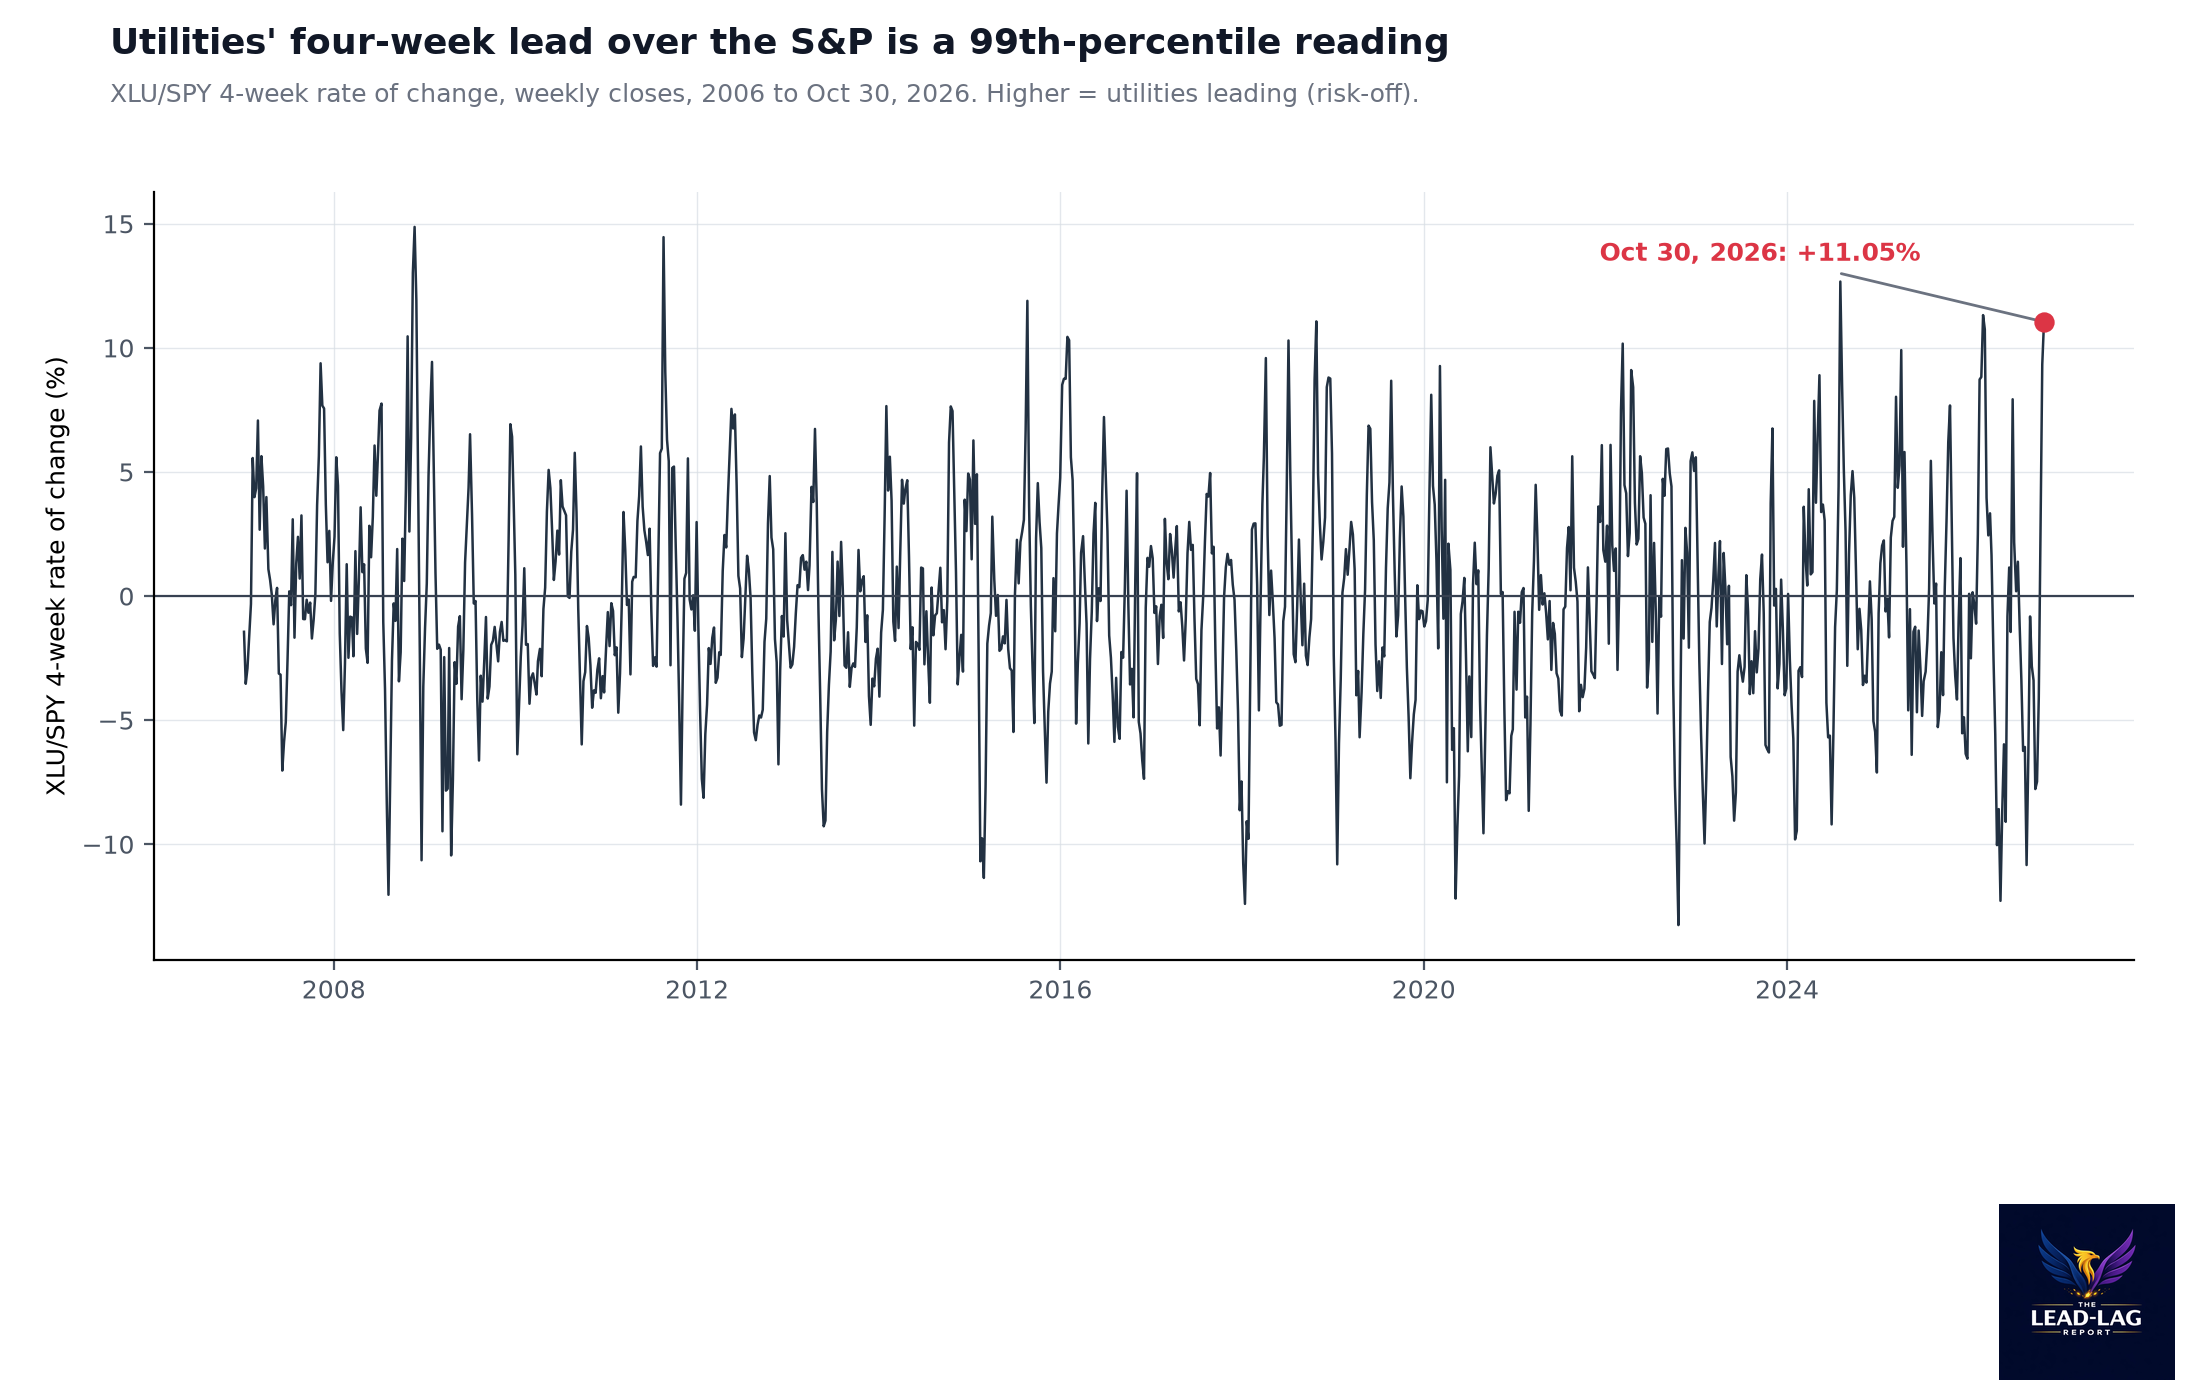
When the 4-week change in the utilities-to-S&P ratio is positive, defensive stocks are leading and the signal reads RISK-OFF. It reads +11.05% this week, up from +9.33%. It has held RISK-OFF for three weeks after twelve straight RISK-ON weeks. Three weeks ago, on October 9, it read -4.10%. Twelve weeks ago, on August 7, it read -6.24%. The sleeve holds utilities.
The level is now extreme. Across 1,035 weekly readings since 2006, only 9, counting this one, have been at or above +11.05%. That is the 99th percentile. Last week I studied what followed the first week the reading crossed +8%, and found a weak month and a split quarter. This week the reading went higher, but the episode is the same one, so that study does not get a new data point. A higher number inside the same episode tells us the rotation is intensifying, not that a second warning has arrived.
For next week, the reading is locked in. To flip back to RISK-ON on November 6, the XLU/SPY ratio would need to fall 7.45% in one week, back below its October 9 level. Expect Beta Rotation to read RISK-OFF in the November 9 edition.
Signal 2: Treasury Rotation (TLT vs IEF, Prior Month)
This signal compares the prior full month's return on 20-plus year Treasuries with 7-10 year Treasuries. When long bonds beat intermediates, investors are paying up for duration, which usually means they expect slower growth, and the signal reads RISK-OFF. October's spread was +2.48 points: TLT returned 5.22% and IEF 2.74%. The signal flipped from RISK-ON this week. Three weeks ago it read RISK-ON on September's data, when TLT lost 5.74% and IEF lost 3.70%. Twelve weeks ago, on August 7, it read RISK-ON on July's data, a spread of -3.12 points. The sleeve rotates out of SPY to its risk-off holding.
The move behind it was a rally across the curve. The 10-year Treasury yield fell from 5.28% on October 2 to 4.98% on October 29, per FRED. The 2-year fell from 4.83% to 4.61% over the same dates. A 30-basis-point drop in the 10-year in a month is enough to move long bonds roughly twice as far as intermediates, which is what the signal measured.
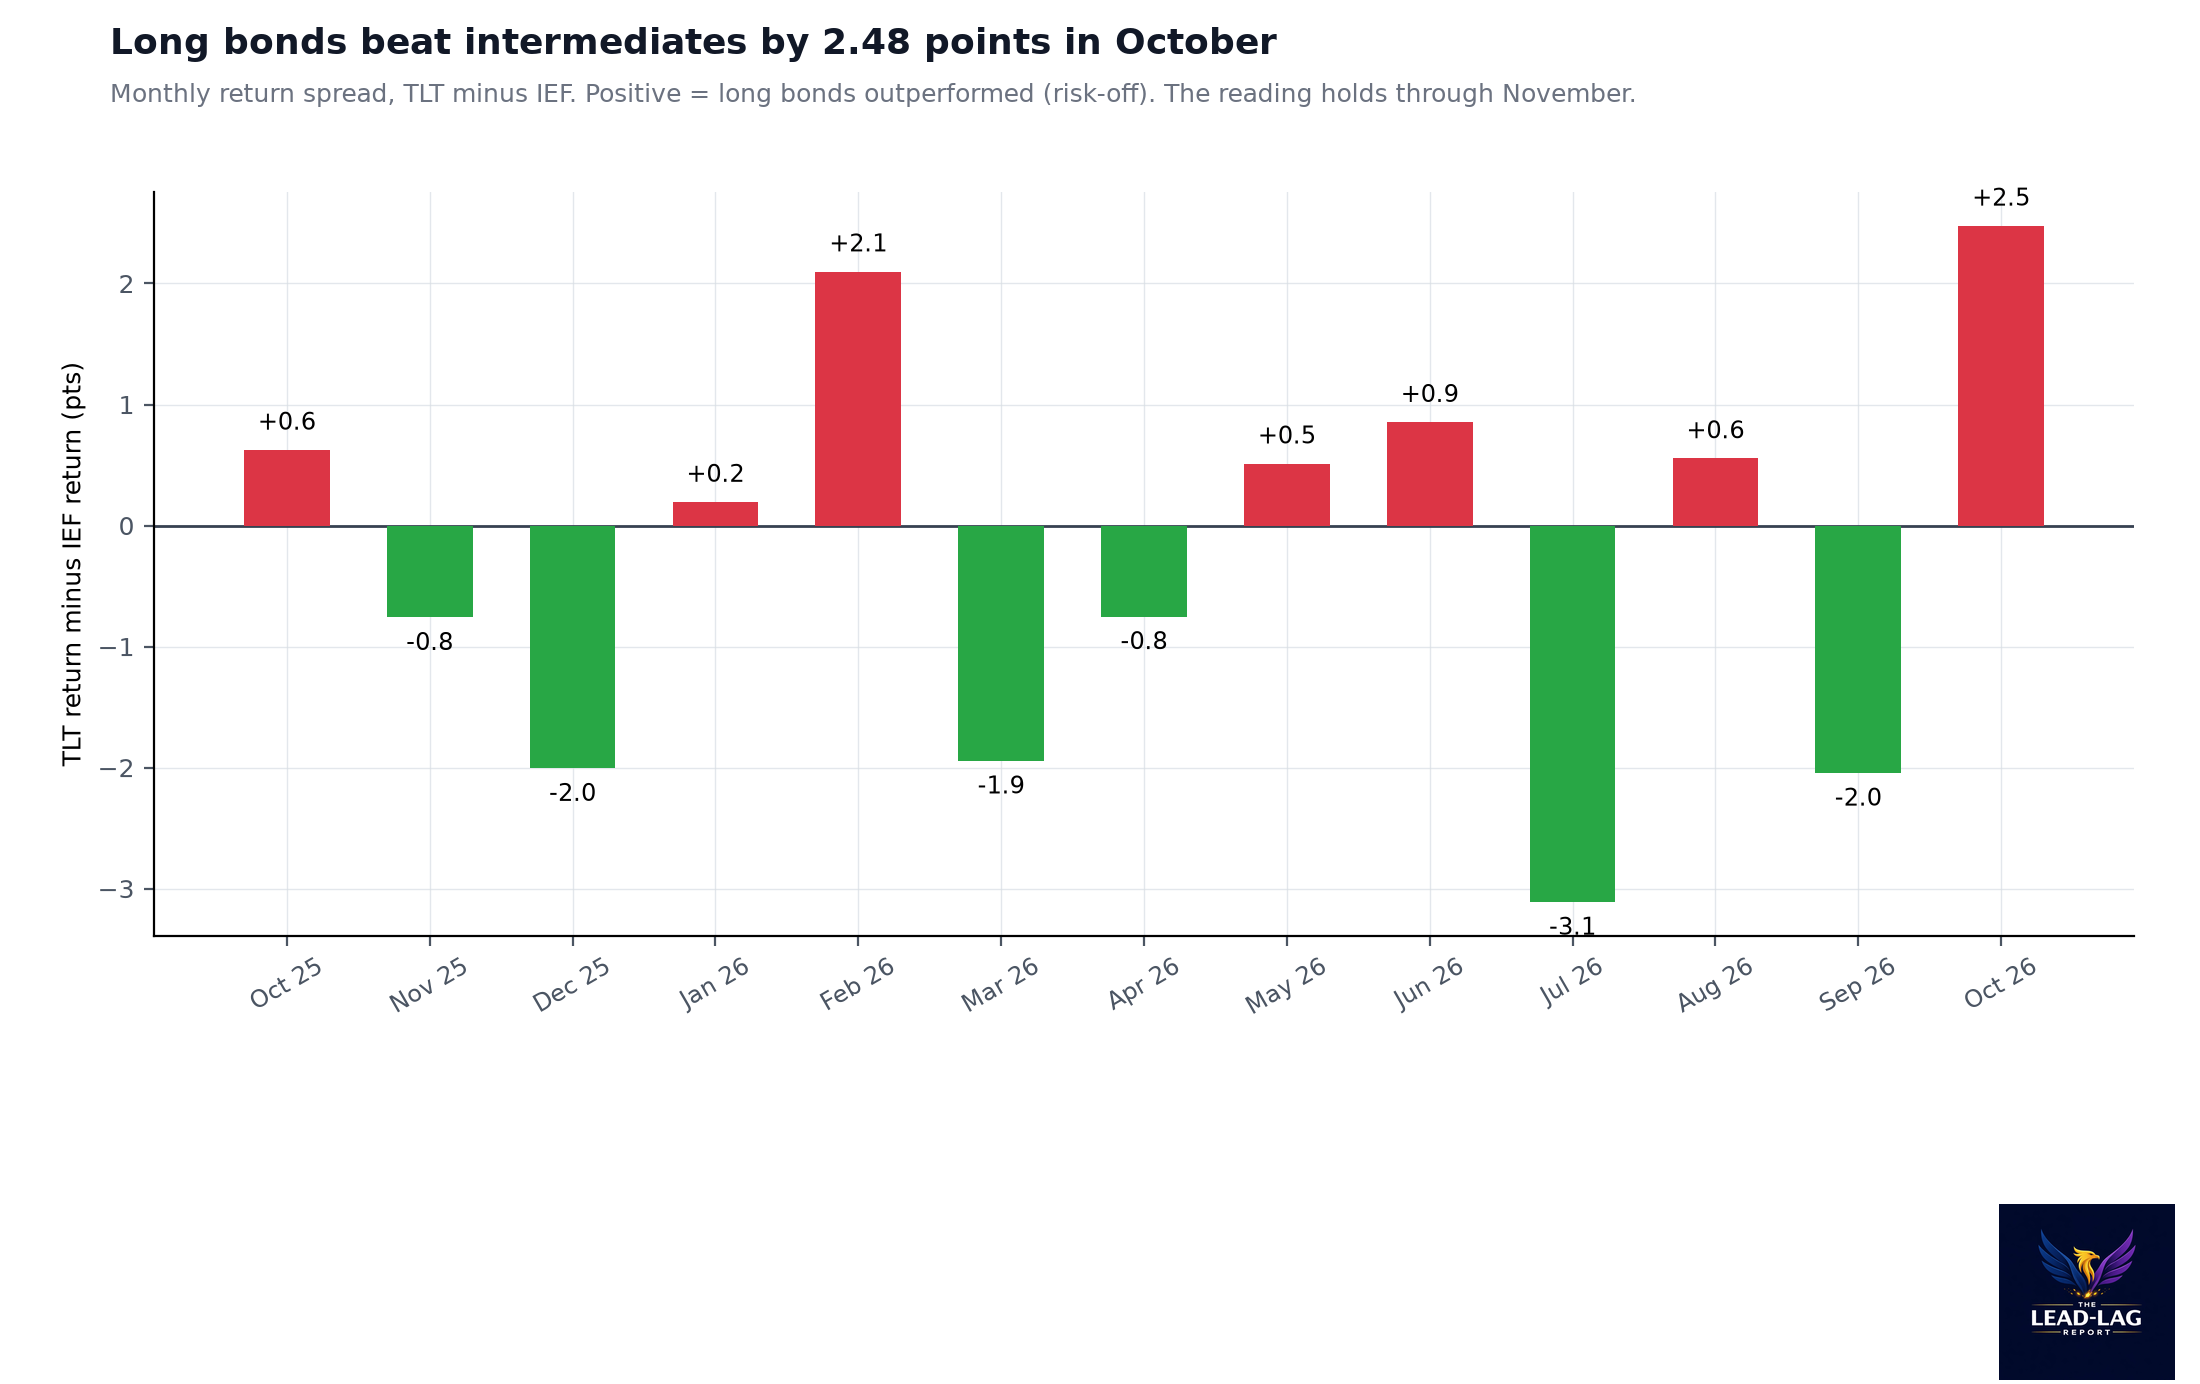
This is the signal I can say the most about in advance. It cannot change until the December 7 edition, because November's data will not be complete until November 30. Whatever happens in stocks this month, Treasury Rotation reads RISK-OFF for four more weeks.
Signal 3: Lumber/Gold (13-Week Relative Performance)
Lumber tracks housing and construction demand. Gold tracks fear and the debasement trade. When lumber beats gold over 13 weeks, growth is outrunning fear and the signal reads RISK-ON. Lumber closed at 521.5 and gold at 3,875.64. Over 13 weeks, lumber is down 15.07% and gold is down 4.19%, a gap of -10.87 points. The signal has read RISK-OFF for twelve straight weeks, since August 14. Three weeks ago the gap was -16.24 points. Twelve weeks ago, on August 7, it was +7.75 points and the signal read RISK-ON. The sleeve holds GOVT.
Next week is where this signal gets interesting, and where I want to be clear about what a flip would mean. The 13-week window for November 6 starts at the August 7 closes, when lumber was 579.0 and gold 4,341.94. If both are flat from Friday, lumber would be down 9.93% over 13 weeks and gold down 10.74%. That is a gap of +0.81 points, and the signal would flip to RISK-ON. A 0.9% drop in lumber, or a similar rise in gold, would keep it red. The anchors after that, August 14 and August 21, set the bar lower still for a flip: with prices flat, the gap would be +3.26 and +6.66 points.
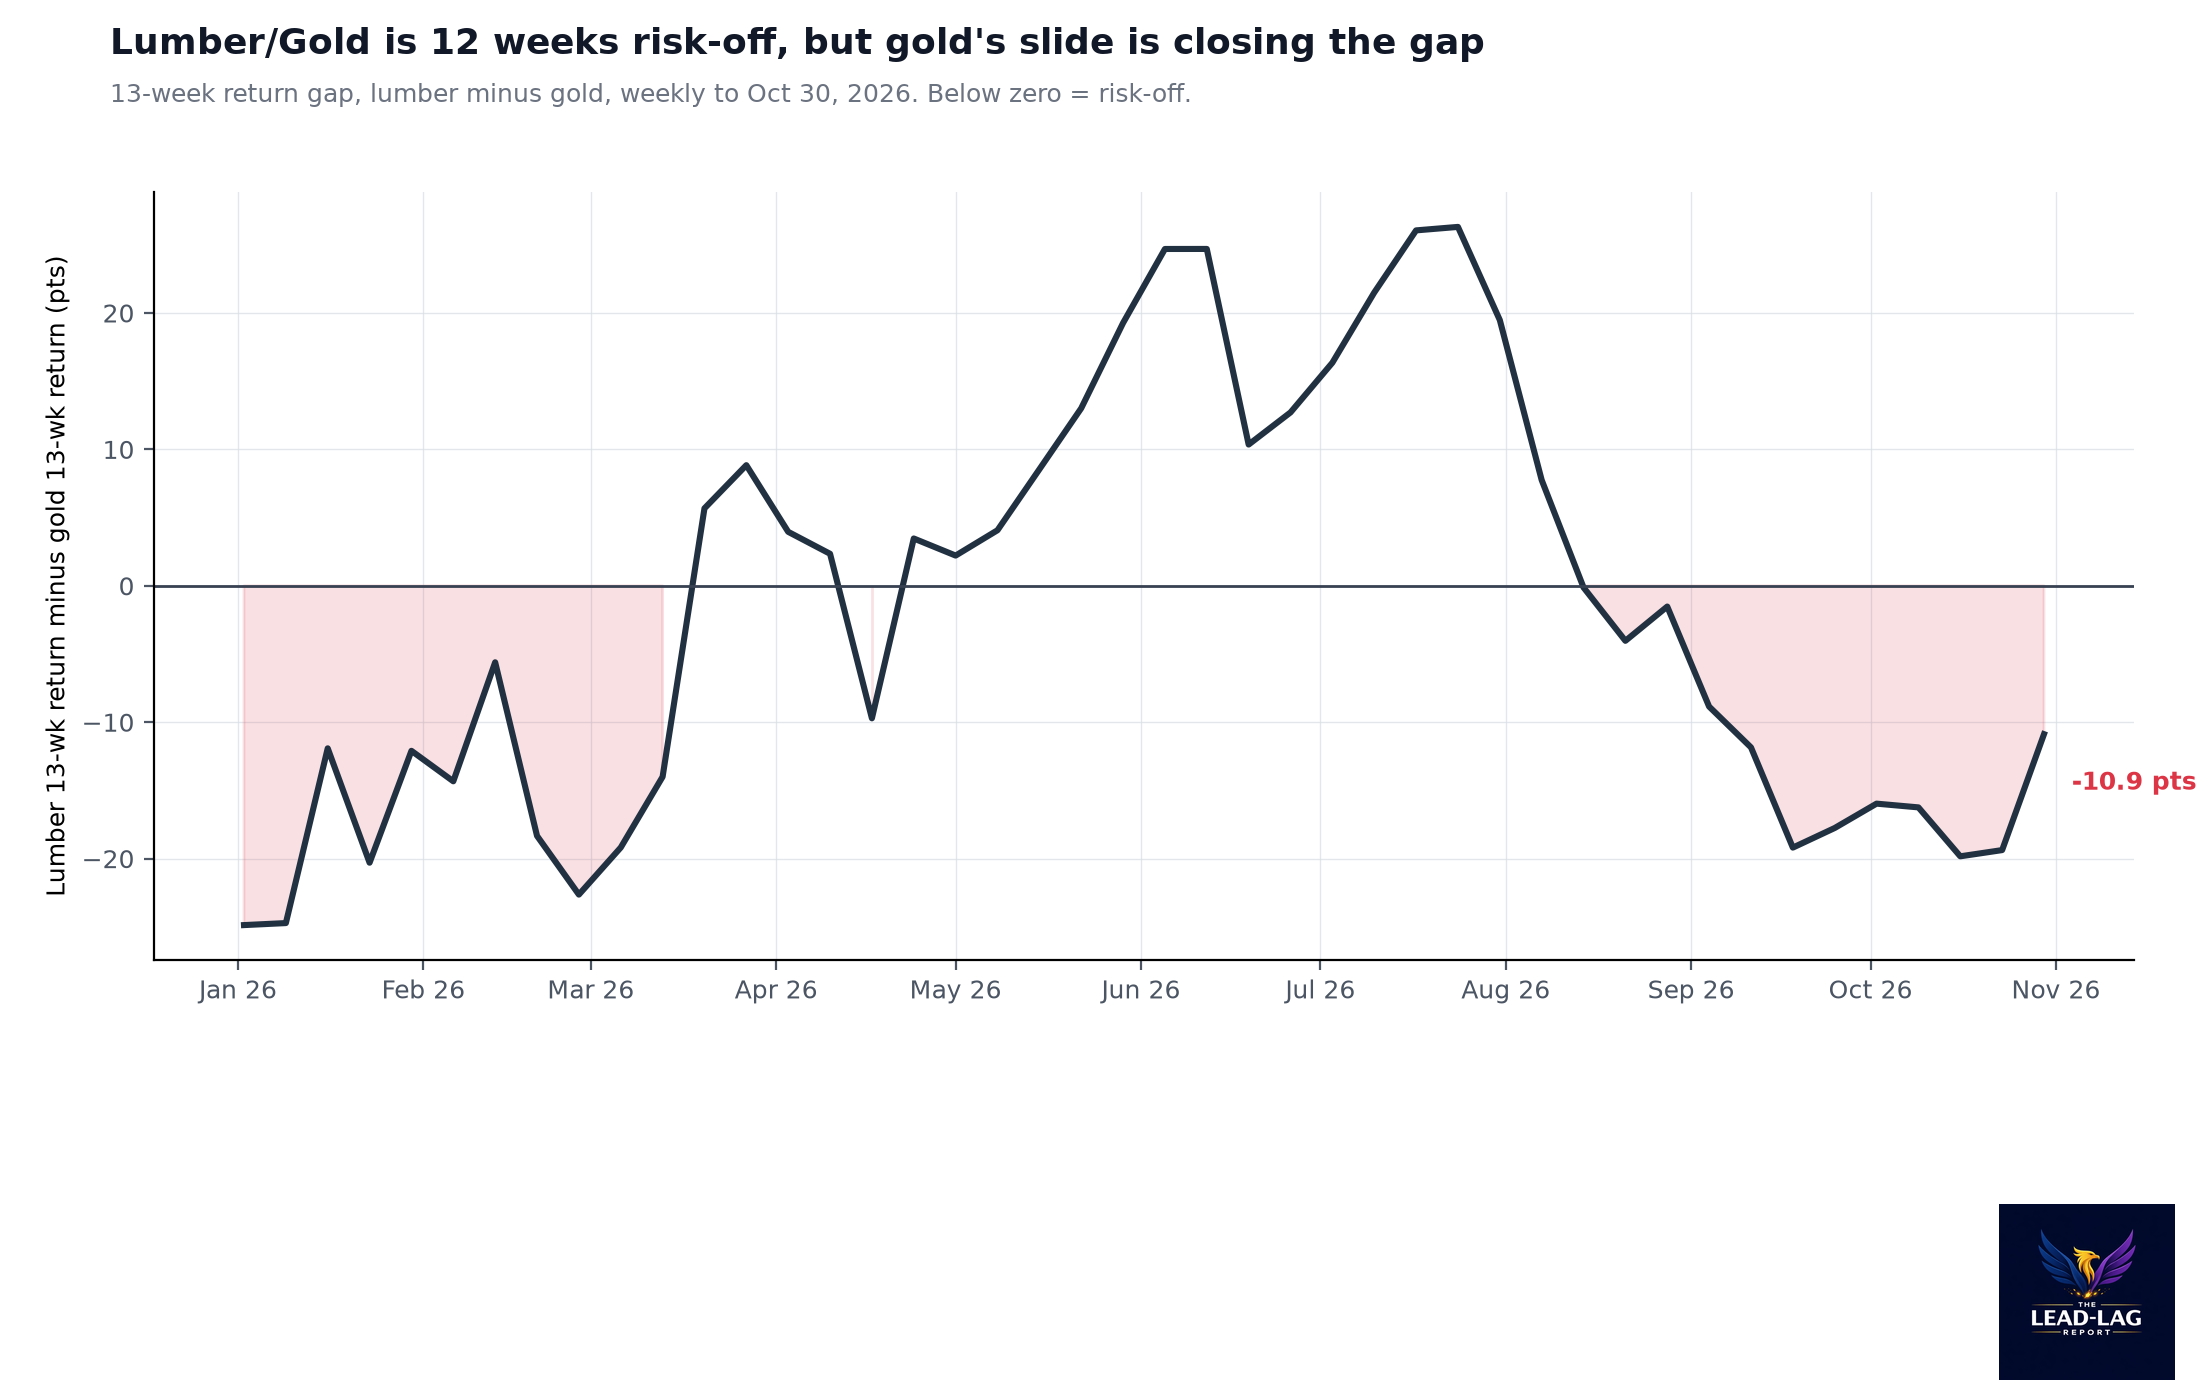
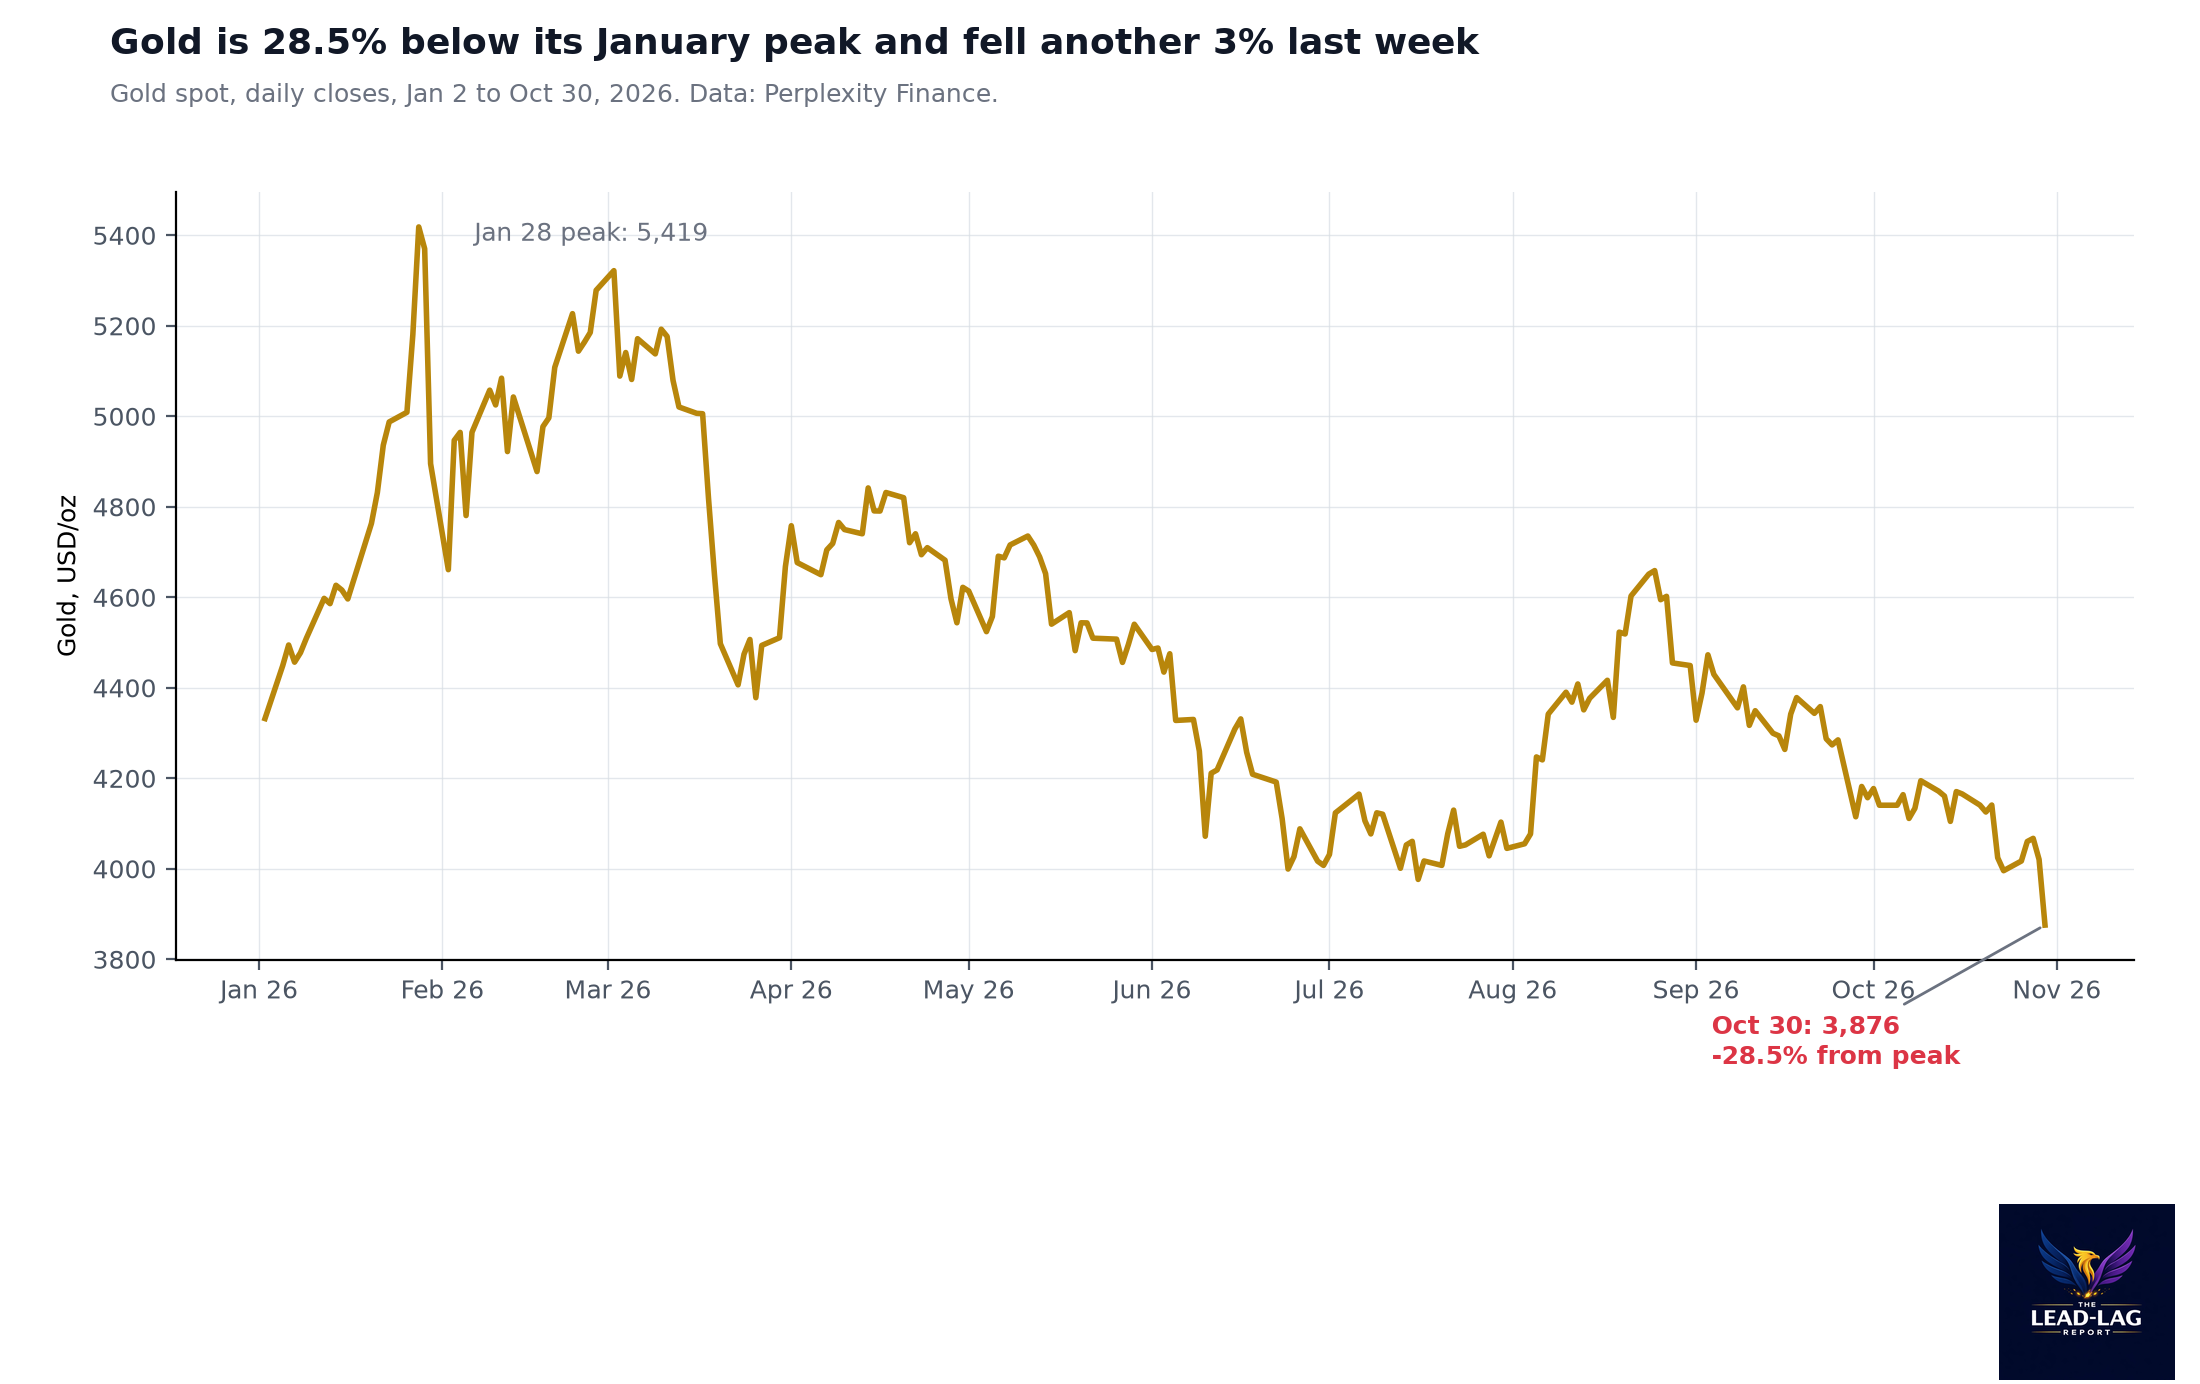
A RISK-ON flip driven by gold falling 28% from its peak is not the same as one driven by lumber rallying on housing demand. Lumber is up 0.58% for the week but still 15.07% lower over 13 weeks. If the signal turns green next week, I will report it as green, because the rules are the rules. I will also say plainly that it would be green because fear's favorite asset is falling, not because construction is picking up.
Signal 4: 200-Day Moving Average (SPY vs SMA)
SPY closed at 755.72 against a 200-day average of 728.85, a cushion of 3.69%. It has closed above the line every day since April 7, 144 trading days. A week ago the cushion was 4.53%. Three weeks ago, on October 9, it was 7.70%. Twelve weeks ago, on August 7, it was 10.00%. The cushion has shrunk by almost two-thirds since August, but the signal has not wavered, and the sleeve holds SSO.
If SPY stayed flat, the 200-day average would rise to about 730.57 by November 6 and 732.13 by November 13, as older and lower closes roll out of the window. A close below 730.57 next Friday would need a 3.33% decline in five sessions. SPY fell 1.77% on Friday alone, so that is not remote.
The Original Computation: What a One-to-Three Board Has Meant
A board this defensive invites a simple reaction: three of four signals say risk-off, so reduce risk. I wanted to know whether that reaction has paid. The daily data behind this column starts in late 2024, which is too short to answer the question. So this week I rebuilt the four-signal score on weekly data from October 2008 to October 2026, 944 weeks in all. Beta Rotation and Lumber/Gold use their normal rules on Friday closes. Treasury Rotation uses the last completed month as of each edition date. Because weekly data cannot produce a 200-day average, I used SPY's 40-week average, which covers about the same span.
I then found every week the score fell to one or zero from two or more. There were 58 such entries before this one. Over the next 13 weeks, SPY's median return was +4.74% and it rose 81% of the time. Across all 944 weeks, the median was +4.08% and the hit rate 75%. A defensive board, taken alone, has not been a reason to sell. If anything, it has marked weeks when the bad news was already in the price.
The cases that match today are narrower. In 30 of the 58 entries, SPY was still above its 40-week average, as it is now. SPY was higher 13 weeks later in 25 of those 30, with a median return of +3.68%. Then I split those 30 by what the trend did next. In 27, SPY held above its 40-week average for the following four weeks. Their median 13-week return was +4.04%, the hit rate 85%, and the median drawdown along the way only 1.59%. In the other three, SPY broke below the average within four weeks: May 2010, February 2020 and February 2026. Their median 13-week return was +1.02%, but their median drawdown inside those 13 weeks was 8.14%, and February 2020 fell 31.39% at its worst.
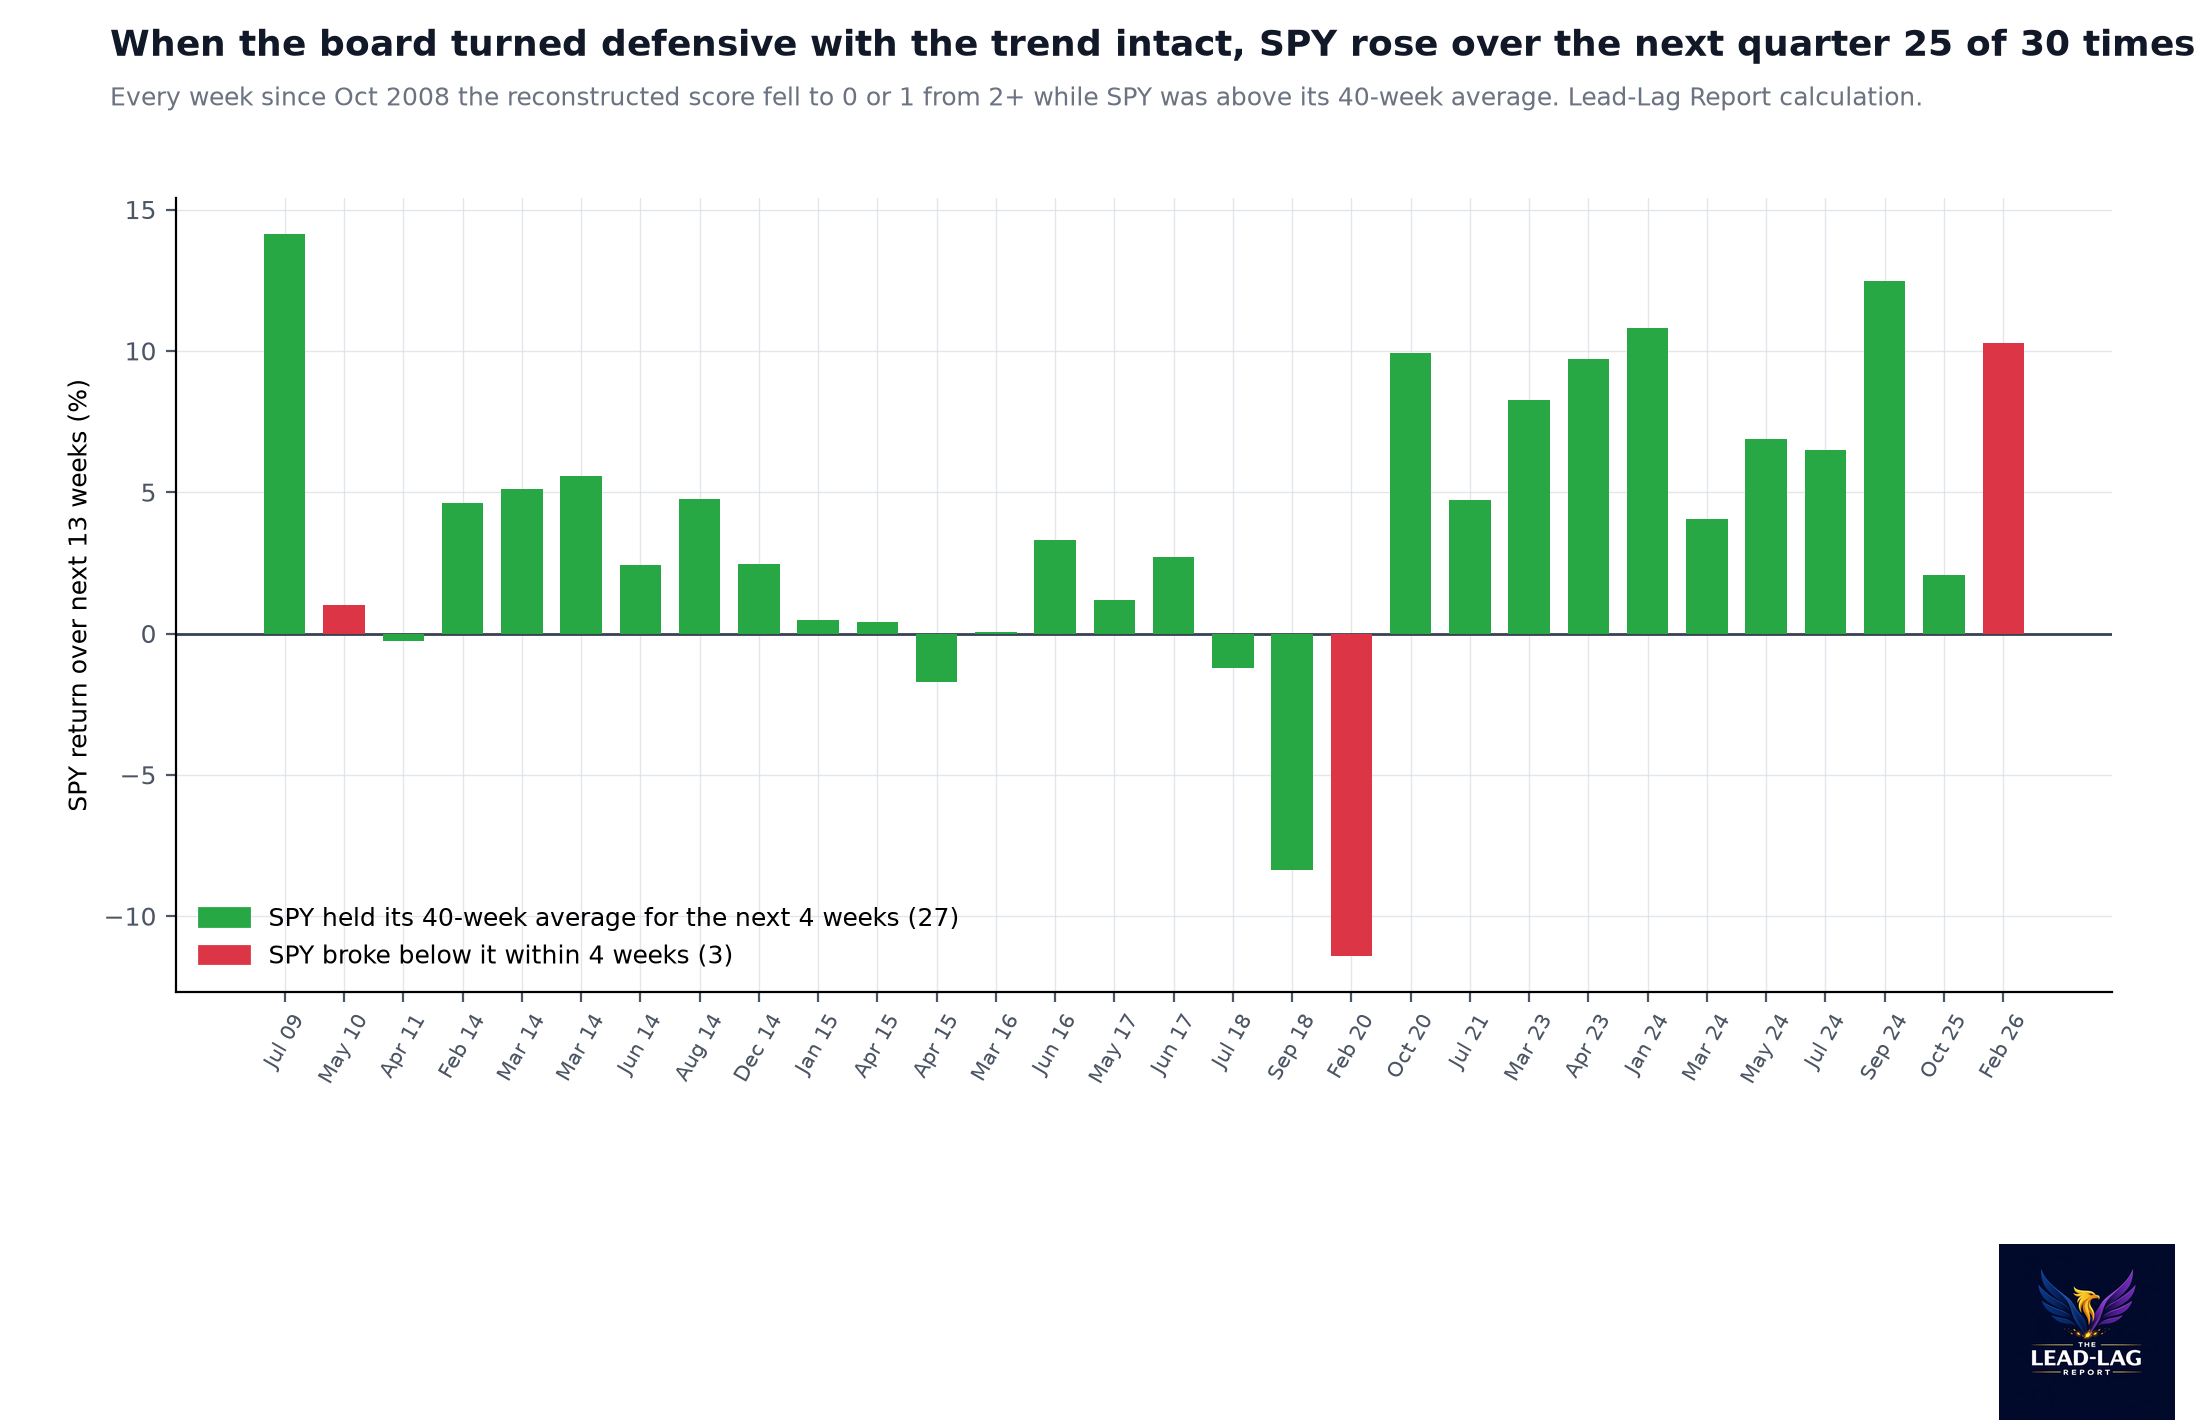
Two of the held cases are worth naming, because they are the ones a bull should worry about. In September 2018 and July 2018, the trend held for four weeks and SPY still ended 13 weeks lower, by 8.36% and 1.23%. So the trend holding for a month is not a guarantee. It is a strong tilt in the odds. And February 2026, the most recent break, is a reminder that this is not an abstraction. The board went defensive in early February, the trend broke in March, and SPY fell 8.19% across that stretch before recovering 14.97% in the next 13 weeks.
How the Four Signals Disagree
The split has a clear shape. The three red signals are relative measures: utilities against the S&P, long bonds against intermediates, lumber against gold. Each one says investors are paying up for safety relative to risk. The one green signal is the only absolute measure, the price of the index against its own trend. The board is telling us that money is rotating defensively inside markets while the market itself has not yet broken down.
The three red signals also differ in how long they are likely to stay red. Treasury Rotation is fixed through November by the calendar. Beta Rotation would need a 7.45% one-week drop in the XLU/SPY ratio to change. Lumber/Gold could flip next week on flat prices, and if it does, the board goes back to two to two without anything having improved underneath. That is the risk in reading the board as a single number this month. A move from one-to-three to two-to-two driven by gold falling is not a healing signal, and I will not treat it as one.
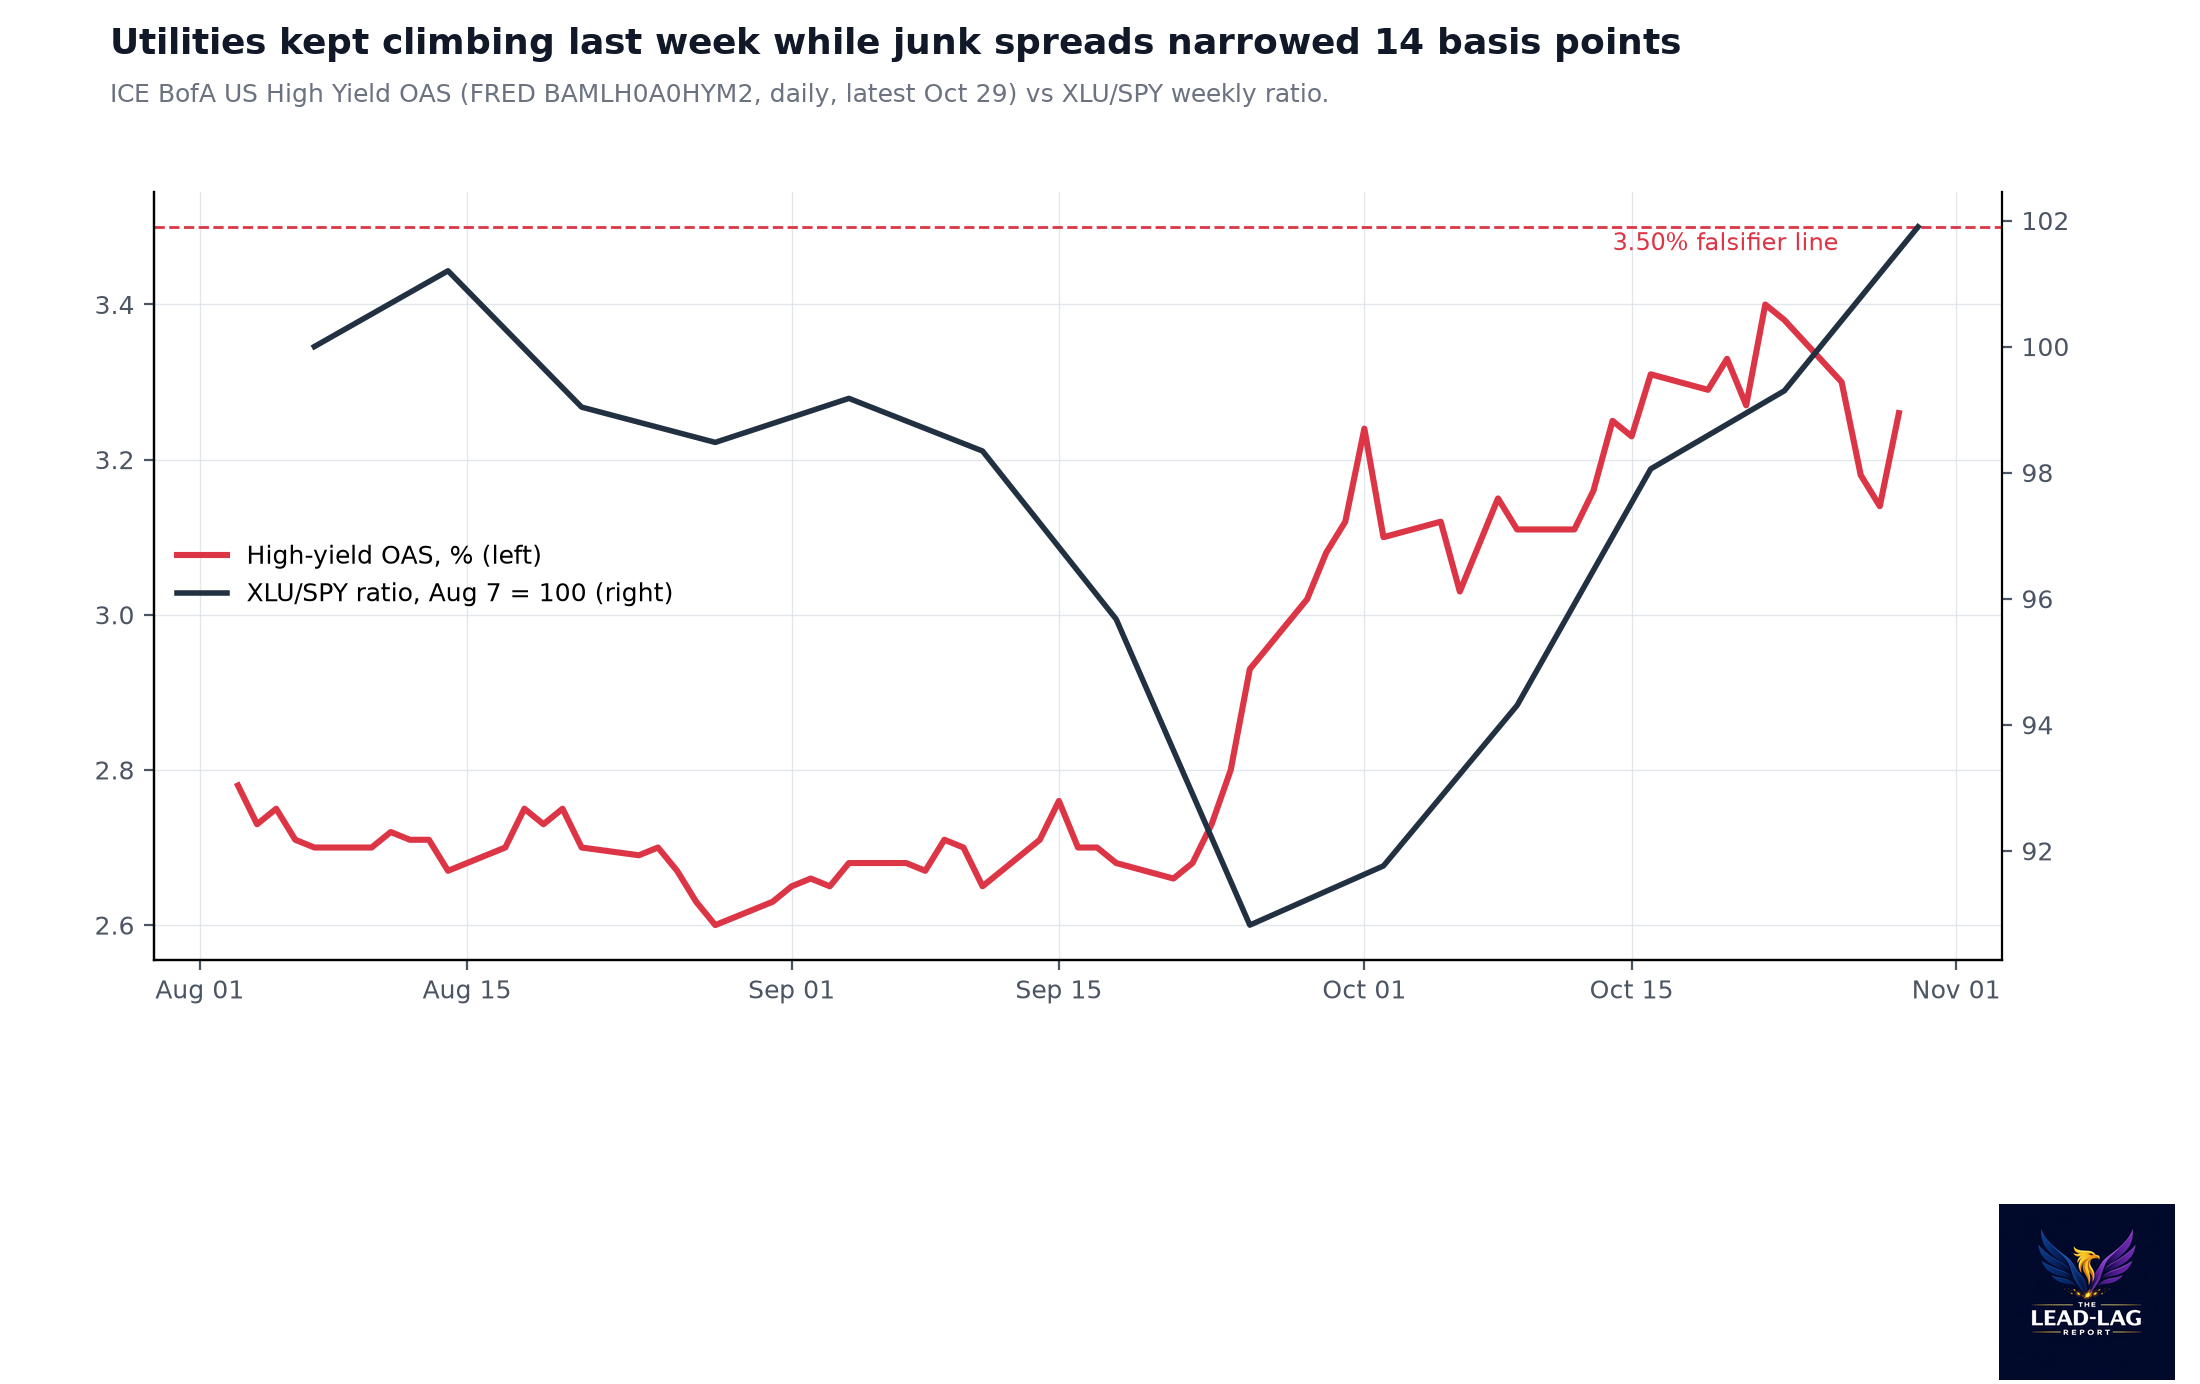
The quieter disagreement is between the signals and credit. Three signals say defense, but the high-yield spread narrowed 14 basis points last week, from 3.40% to 3.26%. Junk bond investors were not running for cover while utility buyers were.
Cross-Asset Check: Credit Relaxed, but CCC Did Not
The ICE BofA US High Yield option-adjusted spread was 3.26% on October 29, per FRED. It peaked at 3.40% on October 22, and it was 2.60% on August 28. So the broad high-yield market has given back some of its October widening, which is the opposite of what a growth scare that is turning into a credit event looks like.
The weakest credit is a different story. The CCC and lower option-adjusted spread was 13.25% on October 29, per FRED, up from 12.15% on October 1. It peaked at 13.56% on October 23. That is a 110-basis-point widening in a month at the bottom of the quality ladder, even as the broad index eased. Lenders are drawing a sharper line between strong and weak borrowers. That is consistent with a slowdown that hurts fragile companies first. It is not yet a broad credit event.
The rates picture fits the same story. The 10-year real yield, measured by 10-year TIPS, fell from 2.92% on October 9 to 2.63% on October 29, per FRED. Gold fell 7.60% over the same stretch. Falling real yields usually help gold, so its decline says this is a duration trade and a dividend-stock trade, not a hard-asset trade. In plain terms, investors are positioning for slower growth with low inflation risk, not for a currency or inflation shock.
The Case Against This Read
The strongest case against my read is that my own study says the danger is in the breaks, and February 2026 broke. That case is eight months old, it started from almost the same position, with SPY 1.16% below its high and above its trend, and it turned into an 8% decline. The same setup this time has a thinner cushion. On February 27, SPY was 4.86% above its 200-day average, and it still broke below on March 19. Today a 3.33% decline would cross it by next Friday. The difference between the 85% hit rate and the losing cases is one bad week.
The internals argue for caution too. SPHB is 12.29% off its October 6 close while SPY is 3.00% off its high, and on Friday SPHB fell 4.86% in a session. That gap between the riskiest stocks and the index is what a narrowing market looks like before the index follows. CCC spreads widening 110 basis points in October shows the stress is real at the weak end of credit. A 99th-percentile utility run is not something investors do for fun. Someone is paying up for safety for a reason.
My study also has limits I should state. It uses a 40-week average rather than a 200-day average, weekly rather than daily data, and 30 overlapping cases from one 18-year stretch. The 40-week average and the 200-day line are close, but they are not identical, and a weekly close can miss a daily break. Thirty cases is enough to show a tilt, not enough to be precise about a 3.68% median.
My answer is that the bear case and my case agree on the variable. If the trend line breaks, I am wrong to stay patient, and the board will say so at zero to four. If it holds, history says de-risking on a one-to-three board has cost more than it saved. I would rather wait for the one signal that has separated the bad cases than act on the three that have not.
What to Watch: Falsifiers
- November 13 close, SPY below 732.1. That is where the 200-day average will sit by then if prices hold flat. A close below it would flip the last green signal, match the setup of the three trend-break cases, and I would stop treating this board as a buyable rotation. It needs a 3.12% decline from 755.72.
- November 20 close, high-yield spread at or above 3.50%. It was 3.26% on October 29. A move through 3.50% would mean broad credit has joined CCC and the utility trade. That would turn a rotation inside an uptrend into a confirmed risk-off move.
- January 29, 2027 close, SPY below 755.72. That is Friday's close, 13 weeks out. If SPY is lower then, the 85% base rate for a held trend failed this time, or the trend broke and the first falsifier fired first. Either way, I will report it.
One mechanical expectation, not a falsifier: if lumber and gold are both within about 0.9% of Friday's closes on November 6, Lumber/Gold reads RISK-ON in the November 9 edition. Treasury Rotation and Beta Rotation will both still read RISK-OFF.
Conclusion and Allocation Guidance
With the composite at one risk-on and three risk-off, the allocation rules tilt defensive mechanically. The sleeves read: Beta Rotation holds utilities, Treasury Rotation moves to its risk-off holding, Lumber/Gold holds GOVT and the 200-Day Average holds SSO. That is a more defensive mix than last week, and it arrives without a judgment call, which is how the strategy is built.
What I want readers to take from the board is that its message is narrower than its score. Three signals say money is rotating into safety, and they are right about that. They have not been, on their own, a reliable warning about the next quarter. The trend line has been. Until SPY closes below its 200-day average, this is a defensive rotation inside an uptrend, not the start of a broken market. These signals describe the market's posture. They are not a prediction, and the allocation rules respond to them mechanically.
Bottom Line: the board is one to three for the first time since March, utilities are on a 99th-percentile run and October flipped the bond signal red, but since 2008 a board this defensive with the trend intact has usually been followed by gains, so the 200-day line near 730 is what decides whether this becomes a sell signal.
Annual paying members get a free print copy of The Price of a Quiet Yen or Intermarket Analysis and Investing, Third Edition (retail value up to $44.95, U.S. shipping): leadlagreport.com/annual. If you have read either book, an honest Amazon review helps other readers find it: The Price of a Quiet Yen and Intermarket Analysis and Investing.
Notes
- All equity, ETF, lumber and gold prices are daily closes through Friday, October 30, 2026 via Perplexity finance data (SPY 755.72, XLU 43.43, TLT 81.84, IEF 91.76, LBUSD 521.5, XAUUSD 3,875.64, SPHB 137.50). Weekly returns are Friday to Friday. Signal windows: XLU/SPY 4-week change +11.05% (October 2 to October 30 closes); October completed month TLT +5.22% versus IEF +2.74% from September 30 closes; lumber and gold 13 weeks from the July 31 closes; SPY versus its 200-day simple average of daily closes, 755.72 versus 728.85. The S&P 500 index series was not returned by the data source this run, so Signal 4 uses SPY as in prior editions. VIX closes are from Perplexity finance data.
- Original computation: weekly closes from Perplexity finance data, October 2008 to October 30, 2026, 944 weeks, price only. Beta Rotation and Lumber/Gold use the standard rules on Friday closes. Treasury Rotation uses the last completed month as of the Monday after each Friday. The trend signal uses SPY versus its 40-week simple average as a weekly stand-in for the 200-day average. An entry is a week when the score fell to 0 or 1 from 2 or more the week before. Forward returns are SPY price returns over the next 13 weeks; drawdown is the lowest weekly close in the next 13 weeks versus the entry close. A trend break is any weekly close below the 40-week average in the four weeks after entry. Cases overlap in time and are not independent.
- XLU/SPY percentile: 1,035 weekly 4-week rate-of-change readings from 2006 to October 30, 2026, 9 at or above +11.05%. Scoreboard history uses daily data from December 2024; the "first since March" comparison covers weeks from late September 2025, when the 200-day average first becomes available in this data.
- FRED series: 10-year Treasury yield 5.28% on October 2 and 4.98% on October 29, DGS10; 2-year yield 4.83% and 4.61% on the same dates, DGS2; 10-year real yield 2.92% on October 9 and 2.63% on October 29, DFII10; high-yield option-adjusted spread 2.60% on August 28, 3.40% on October 22 and 3.26% on October 29, BAMLH0A0HYM2; CCC and lower option-adjusted spread 12.15% on October 1, 13.56% on October 23 and 13.25% on October 29, BAMLH0A3HYC. FRED data run through October 29 at the time of writing.
- The multi-year strategy sleeve performance tables are not refreshed in this edition.
- Michael's books: The Price of a Quiet Yen and Intermarket Analysis and Investing, Third Edition, at leadlagreport.com/books.
- Update section: daily closes through Tuesday, November 3, 2026 via Perplexity finance data (SPY 754.35, XLU 43.42, TLT 81.11, IEF 91.16, LBUSD 525.5, XAUUSD 3,930.32, SPHB 137.10; August 7 anchors LBUSD 579.0, XAUUSD 4,341.94; October 6 closes for the 4-week window; 200-day average from the 200 daily SPY closes through November 3). FRED: high-yield option-adjusted spread 3.26% on October 29, 3.44% on October 30 and 3.40% on November 3, BAMLH0A0HYM2; CCC and lower 13.16% on November 3, BAMLH0A3HYC.