The Labor Force Did Not Shrink by a Million. A Census Update Did.
The published labor force fell 999,000 in a year. On BLS comparable data it grew about 279,000, and unemployment fell to 4.2%.


Free for advisors today: Referral Partner Outreach Kit

Better conversations with CPAs, attorneys and other centers of influence. Positioning, a value exchange, intro and follow-up copy and talking points for the professional partners who can send you clients.
What you receive
- Referral partner positioning
- Intro outreach email
- Follow-up sequence
- Talking points
- LinkedIn or short-message copy
Cost in credits: 2. Turnaround: 2-3 business days. Delivered as: an AI-prepared draft that you review. Best for: Advisors building a referral network.
It is free for advisors. There is no invoice from us. You earn the credits by showing up: attend a sponsored Lead-Lag Media webinar, meet a fund issuer in a one-on-one introduction, or join one of our advisor dinners.
Prefer to browse first? See all 34 services at advisor.leadlagmedia.com.
Credits carry no cash value and are not payment for services. Drafts are prepared with AI assistance and are for your and your firm’s review before use; they are not investment, legal, tax or compliance advice, and nothing is guaranteed. Services are offered to financial advisors and are not a solicitation to retail investors.
The published data say the labor force shrank by a million people. It did not.
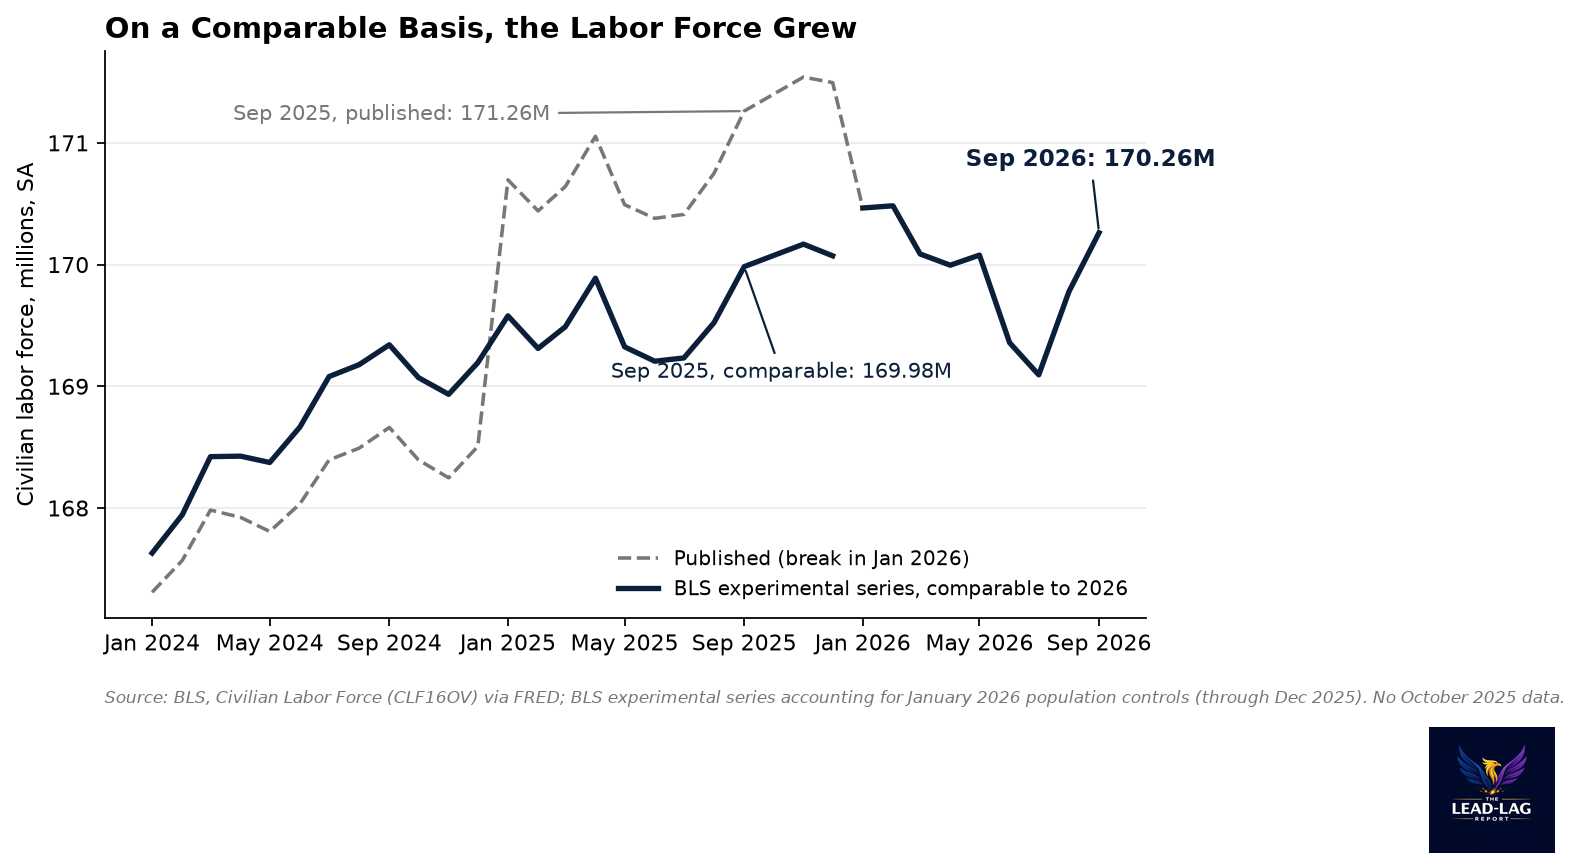
Take the official household survey at face value and the past year looks alarming. The civilian labor force was 171.26 million in September 2025 and 170.26 million in September 2026, a drop of 999,000 people.[1] The participation rate fell from 62.5% to 61.8%.[2] On those two numbers alone, you would conclude that Americans are leaving work in large numbers and that the falling unemployment rate is an illusion.
Most of that drop happened in a single month, and it was not a month of layoffs. Between December 2025 and January 2026 the published labor force fell by 1.03 million, from 171.50 million to 170.47 million.[1] That is the month the Bureau of Labor Statistics brings in new population estimates from the Census Bureau.
Once you put the two years on the same footing, the story turns around. The labor force did not shrink. It grew.
What happened in January
The household survey is a sample. To turn roughly 60,000 households into national totals, BLS weights the responses to match independent Census estimates of the population by age, sex, race and ethnicity. Those population controls are updated once a year, usually with January data. The 2026 update was delayed a month by the 2025 federal government shutdown and was published with the February report in March.[3]
This year's update barely changed the size of the population. Applied to December 2025, it lowered the civilian population age 16 and over by just 231,000.[3] But it changed the mix. According to BLS, the adjustment raised the number of people not in the labor force by 1.2 million and cut both the labor force and employment by 1.4 million each. It lowered the participation rate by 0.4 percentage point and the employment-population ratio by 0.5 point.[3]
In plain terms, the Census Bureau's updated estimates contain more people in groups that work less, such as older Americans, and fewer in groups that work more. Nobody quit in January. The survey simply started describing the population differently, and the entire correction going back to the 2020 Census was booked in one month.[3]
BLS does not revise the official history to smooth this out. It does publish an experimental series that restates the 2025 and earlier data so they can be compared with 2026.[4] On that basis, the September 2025 labor force was 169.98 million, not 171.26 million.[4] Against the September 2026 reading of 170.26 million, that is a gain of about 279,000 people in a year, by my calculation.
The participation picture also shrinks to something modest. The comparable September 2025 rate was 62.0%.[4] The decline to 61.8% is 0.2 point, not 0.7. Some of that is real, and an aging population pulls participation down over time. But a 0.2-point drift is a long way from a collapse.
The unemployment rate is the cleaner signal
The one headline measure BLS says the adjustment did not touch is the unemployment rate.[3] The number of unemployed rose by only 15,000 under the new controls, too small to move the rate.[3] So the published unemployment series can be read straight through January.
It says the job market has firmed. Unemployment peaked at 4.5% in November 2025, the highest since October 2021.[5] It was 4.2% in September 2026, down from 4.4% a year earlier.[5] The number of unemployed people fell from 7.61 million to 7.11 million over the same twelve months.[6] One caveat: there is no October 2025 household survey reading because of the shutdown, so the monthly path has a gap.[5]
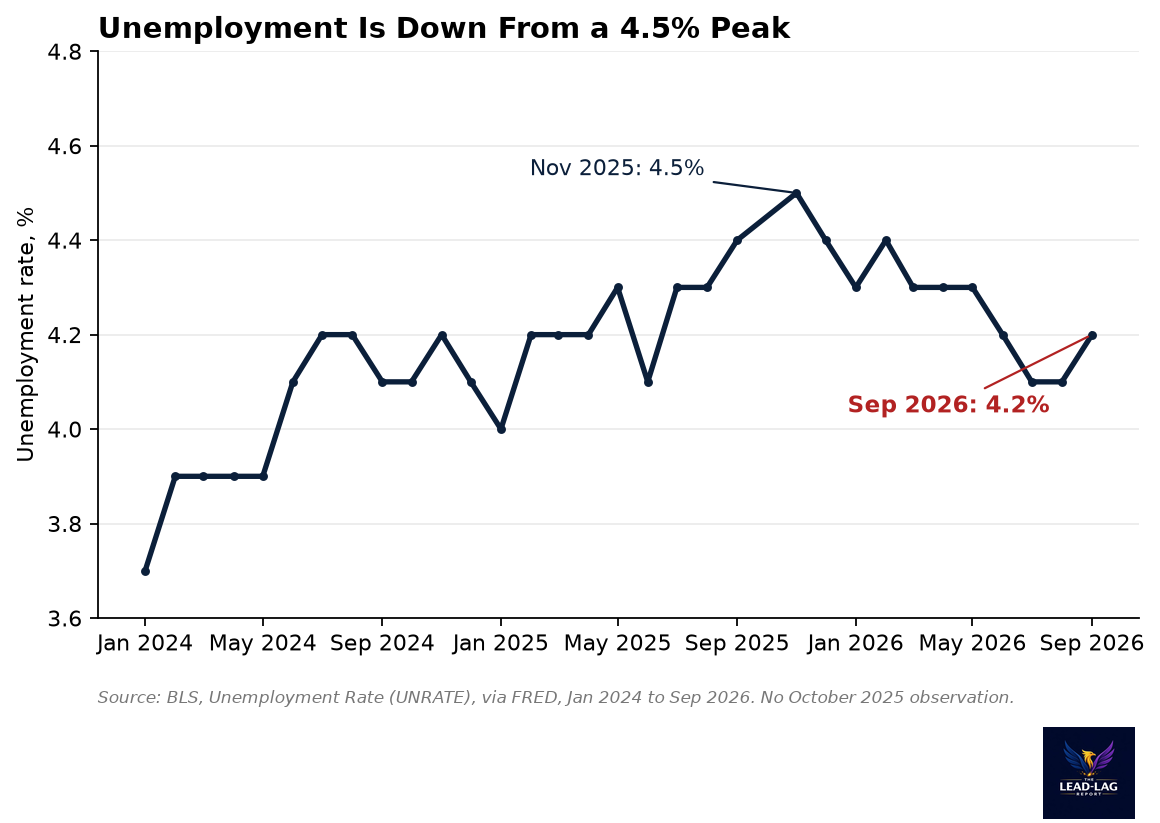
Weekly claims point the same way. Initial jobless claims were 194,000 in the week of October 24, compared with 221,000 a year earlier.[7] Continuing claims, a rough count of people still collecting benefits, were 1.70 million in the week of October 17, down from 1.95 million.[8] Fewer people are losing jobs, and those who do are finding new ones faster.
Job growth is slow, but it is positive
The separate payroll survey of employers is not affected by population controls at all. It shows nonfarm payrolls up 496,000 between September 2025 and September 2026, an average of about 41,000 jobs a month.[9] That is a slow pace by the standards of the past decade. September added 29,000 jobs, July lost 10,000 and February lost 156,000.[9]
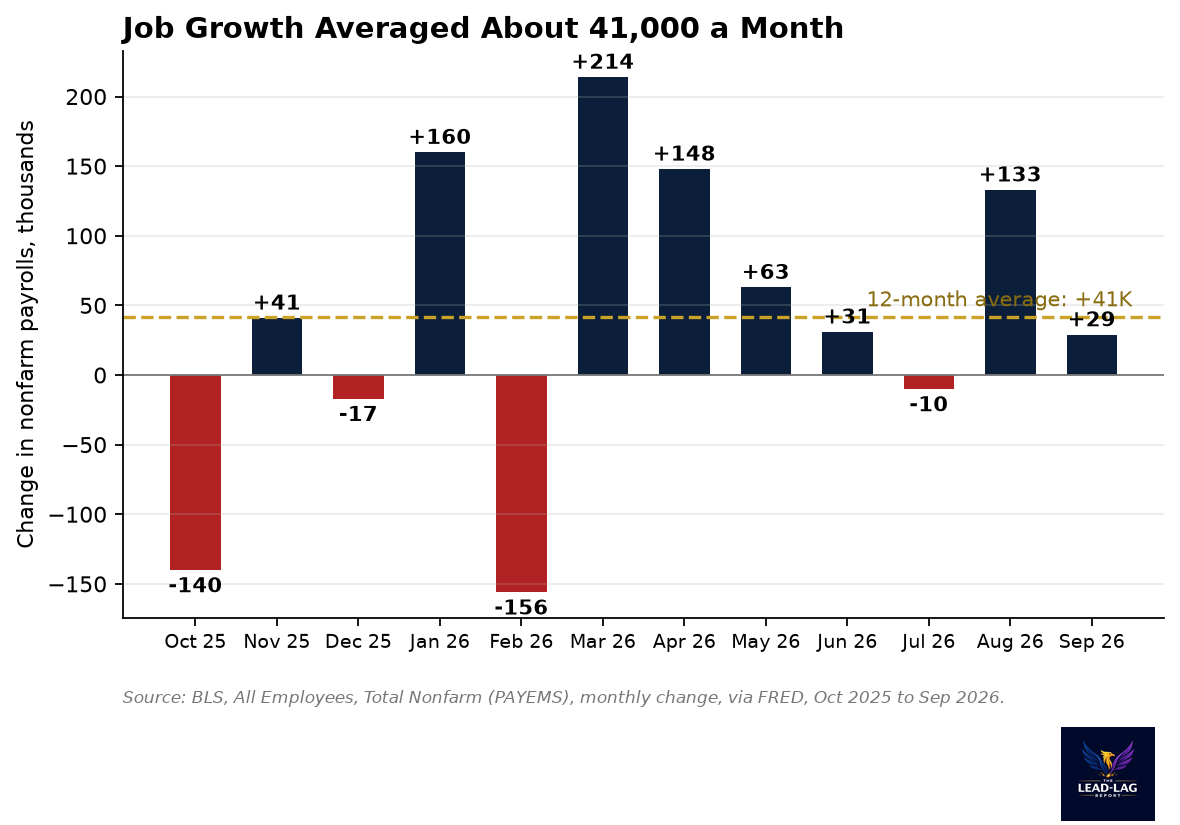
Slow hiring and a falling unemployment rate can coexist when labor force growth is also slow, which is what the comparable data show. A labor force growing by roughly 279,000 a year does not need many new jobs to absorb it.
The job openings survey fills in the rest. In September the quit rate rose to 2.1%, its highest since June 2025.[10] Workers quit when they are confident they can find something better. The hires rate was 3.4% and the layoff rate 1.0%.[11][12] There were 7.52 million job openings against 7.11 million unemployed people, about 1.06 openings per job seeker, by my calculation.[13][6]
That is not the overheated market of 2022, when openings ran far ahead of job seekers. It is also not a market that is shedding workers. It is a low-hire, low-fire market where people who have jobs are starting to feel more secure in them.
Why the distinction matters
Headlines built on the published labor force level will keep showing a year-over-year decline until January 2027, when the comparison finally moves past the break. Anyone reading those headlines will be tempted to treat the drop in unemployment as a statistical trick, where the rate falls only because people stop looking.
The comparable data do not support that reading. On a like-for-like basis, more people are in the labor force than a year ago, fewer of them are unemployed, layoffs are low and quits are rising. Participation has slipped a little, which fits an aging population, but not by enough to explain the drop in unemployment.
There are real soft spots. Payroll growth of 41,000 a month leaves little room for error, and two of the last eight months were negative. A low-hire market is hard on anyone trying to change jobs or enter the workforce. But the specific claim that the labor force lost a million people in a year is an artifact of how the survey is weighted, and it is worth knowing before you build a view of the economy on it.
The broader lesson applies to every January in the household survey. When a series jumps in that month, check whether BLS published a population-control adjustment before you treat the move as news.
Notes
[1] Civilian Labor Force Level, U.S. Bureau of Labor Statistics via FRED, series CLF16OV: https://fred.stlouisfed.org/series/CLF16OV. 171,261 thousand (Sep 2025), 171,495 thousand (Dec 2025), 170,465 thousand (Jan 2026), 170,262 thousand (Sep 2026).
[2] Labor Force Participation Rate, BLS via FRED, series CIVPART: https://fred.stlouisfed.org/series/CIVPART. 62.5% (Sep 2025), 61.8% (Sep 2026).
[3] BLS, Adjustments to Household Survey Population Estimates in January 2026: https://www.bls.gov/cps/methods/population-controls/population-control-adjustments-2026.pdf.
[4] BLS, Experimental series accounting for January 2026 population control effects: https://www.bls.gov/cps/methods/population-controls/experimental-series-accounting-for-january-2026-population-control-effects.htm. Labor force 169,983 thousand and participation rate 62.0% (Sep 2025, comparable basis).
[5] Unemployment Rate, BLS via FRED, series UNRATE: https://fred.stlouisfed.org/series/UNRATE. 4.4% (Sep 2025), 4.5% (Nov 2025), 4.2% (Sep 2026). No October 2025 observation.
[6] Unemployment Level, BLS via FRED, series UNEMPLOY: https://fred.stlouisfed.org/series/UNEMPLOY. 7,605 thousand (Sep 2025), 7,109 thousand (Sep 2026).
[7] Initial Claims, U.S. Employment and Training Administration via FRED, series ICSA: https://fred.stlouisfed.org/series/ICSA. 194,000 (week of Oct 24, 2026), 221,000 a year earlier.
[8] Continued Claims (Insured Unemployment), U.S. Employment and Training Administration via FRED, series CCSA: https://fred.stlouisfed.org/series/CCSA. 1,701,000 (week of Oct 17, 2026), 1,953,000 a year earlier.
[9] All Employees, Total Nonfarm, BLS via FRED, series PAYEMS: https://fred.stlouisfed.org/series/PAYEMS. 158,548 thousand (Sep 2025), 159,044 thousand (Sep 2026).
[10] Quits: Total Nonfarm, rate, BLS JOLTS via FRED, series JTSQUR: https://fred.stlouisfed.org/series/JTSQUR. 2.1% (Sep 2026).
[11] Hires: Total Nonfarm, rate, BLS JOLTS via FRED, series JTSHIR: https://fred.stlouisfed.org/series/JTSHIR. 3.4% (Sep 2026).
[12] Layoffs and Discharges: Total Nonfarm, rate, BLS JOLTS via FRED, series JTSLDR: https://fred.stlouisfed.org/series/JTSLDR. 1.0% (Sep 2026).
[13] Job Openings: Total Nonfarm, BLS JOLTS via FRED, series JTSJOL: https://fred.stlouisfed.org/series/JTSJOL. 7,523 thousand (Sep 2026).
The Lead-Lag Report is provided by Lead-Lag Publishing, LLC. All opinions and views mentioned in this report constitute our judgments as of the date of writing and are subject to change at any time. Information within this material is not intended to be used as a primary basis for investment decisions and should also not be construed as advice meeting the particular investment needs of any individual investor. Trading signals produced by the Lead-Lag Report are independent of other services provided by Lead-Lag Publishing, LLC or its affiliates, and positioning of accounts under their management may differ. Please remember that investing involves risk, including loss of principal, and past performance may not be indicative of future results. Lead-Lag Publishing, LLC, its members, officers, directors and employees expressly disclaim all liability in respect to actions taken based on any or all of the information on this writing.