Power Output Hit a Record. Electricity Prices Are Up 42% Since 2021.
Power output set a record in September, up 9.6% in a year, yet electricity prices rose 4.4%, still ahead of overall inflation.


Free for advisors today: Advisor-to-Advisor Introductions

Warm introductions across the Lead-Lag Media network. A facilitated, mutual opt-in introduction to another advisor in the network, with match reasoning and a suggested opening message once both sides agree.
What you receive
- Request summary
- Match criteria used
- Recommended matches when confidence is high
- Why each match fits
- Mutual opt-in next step
- Suggested opening message after both sides agree
Cost in credits: 1. Turnaround: As matches arise. Delivered as: Handled with the Network Desk. Best for: Advisors who want peers to trade ideas, referrals and best practices with.
It is free for advisors. There is no invoice from us. You earn the credits by showing up: attend a sponsored Lead-Lag Media webinar, meet a fund issuer in a one-on-one introduction, or join one of our advisor dinners.
Prefer to browse first? See all 34 services at advisor.leadlagmedia.com.
Credits carry no cash value and are not payment for services. Drafts are prepared with AI assistance and are for your and your firm’s review before use; they are not investment, legal, tax or compliance advice, and nothing is guaranteed. Services are offered to financial advisors and are not a solicitation to retail investors.
Power plants produced more in September than in any month on record, and electricity is still getting more expensive faster than almost everything else.
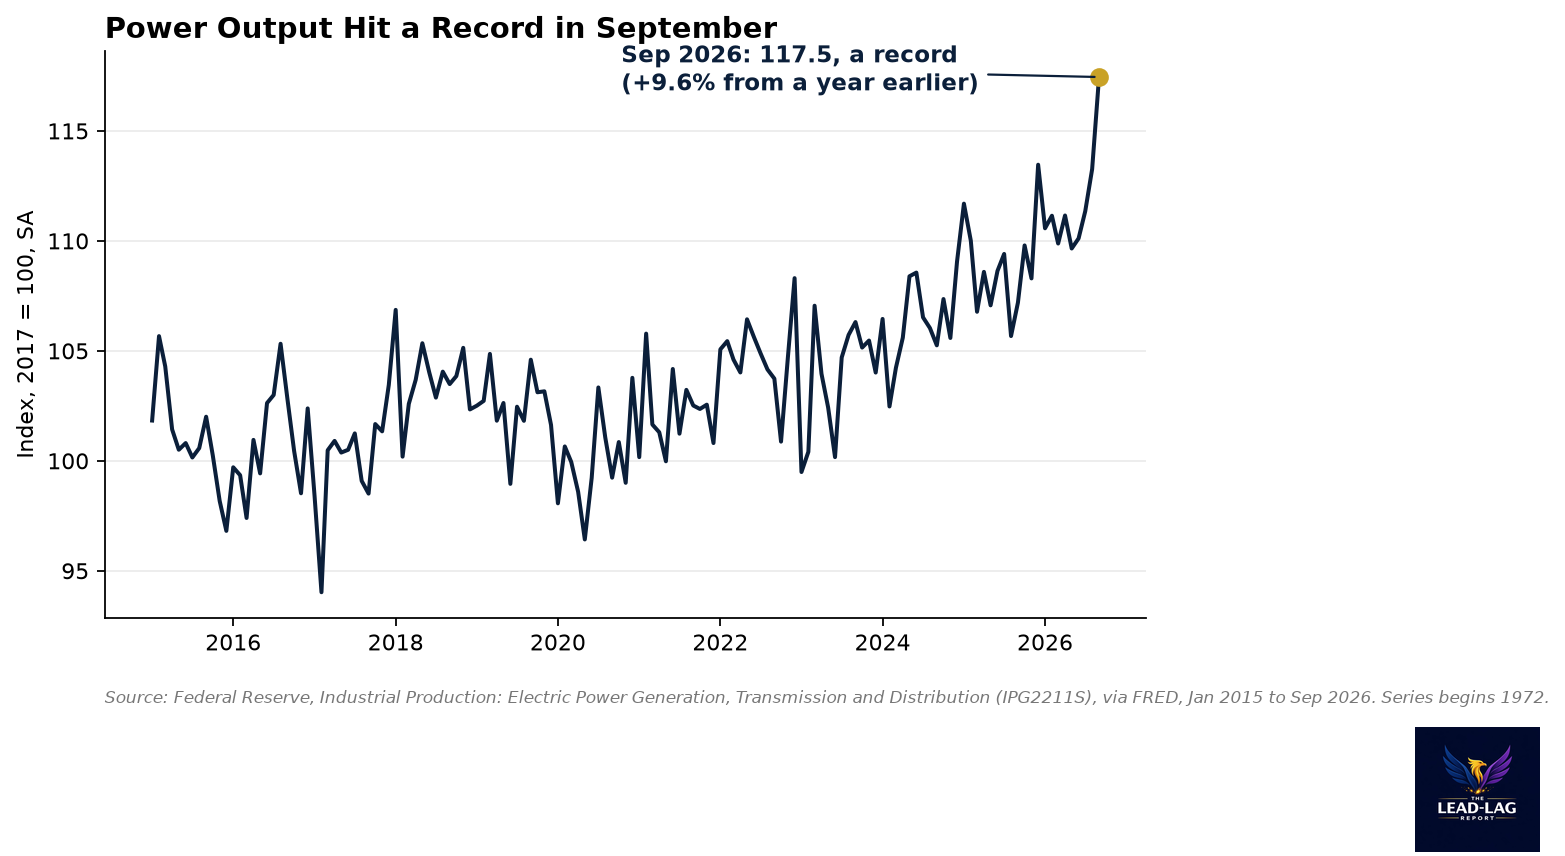
The Federal Reserve's index of electric power generation, transmission and distribution reached 117.5 in September 2026, the highest reading in a series that begins in 1972.[1] Output was up 9.6% from a year earlier, the largest 12-month gain since August 1995.[1]
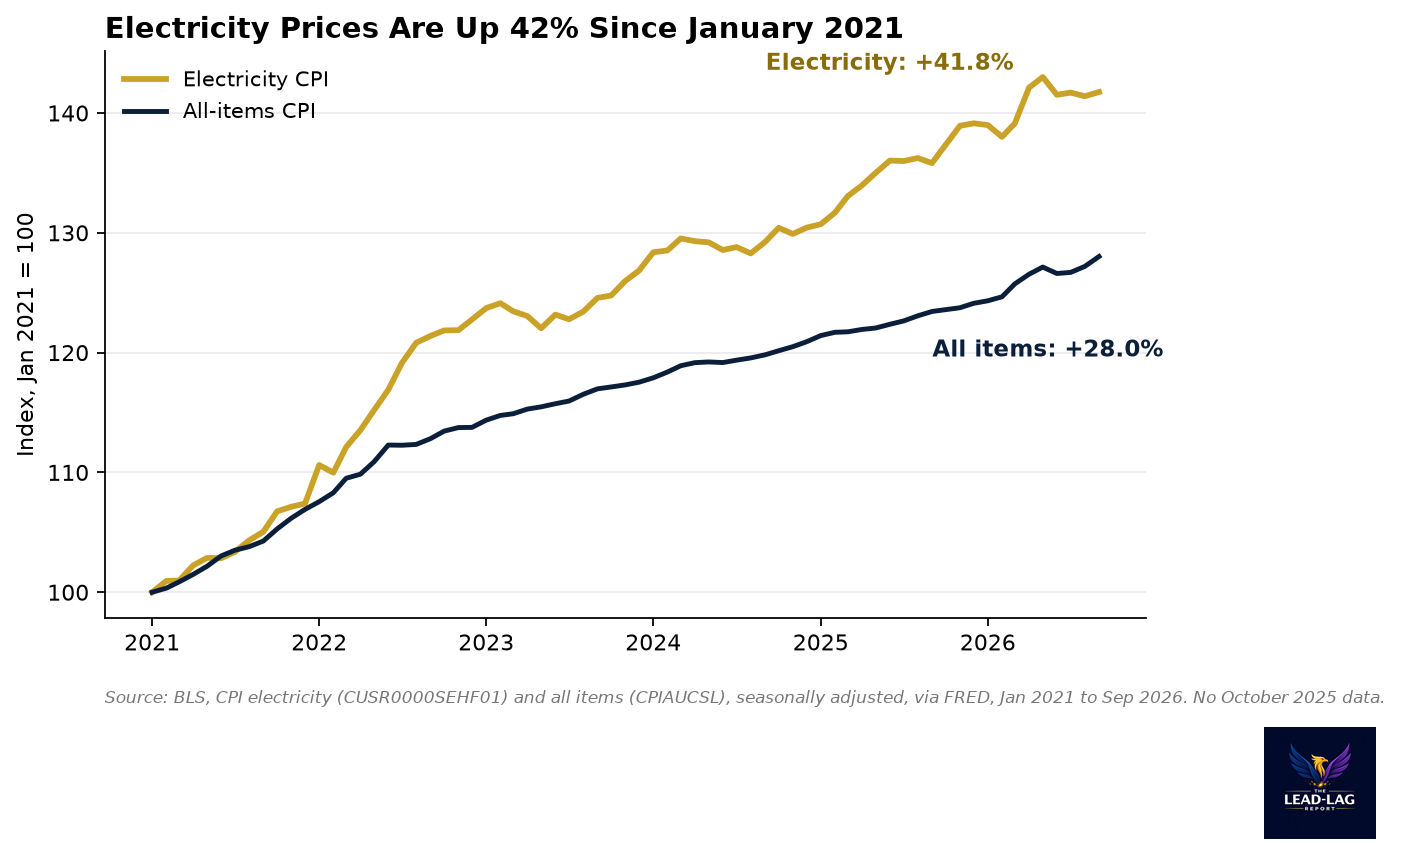
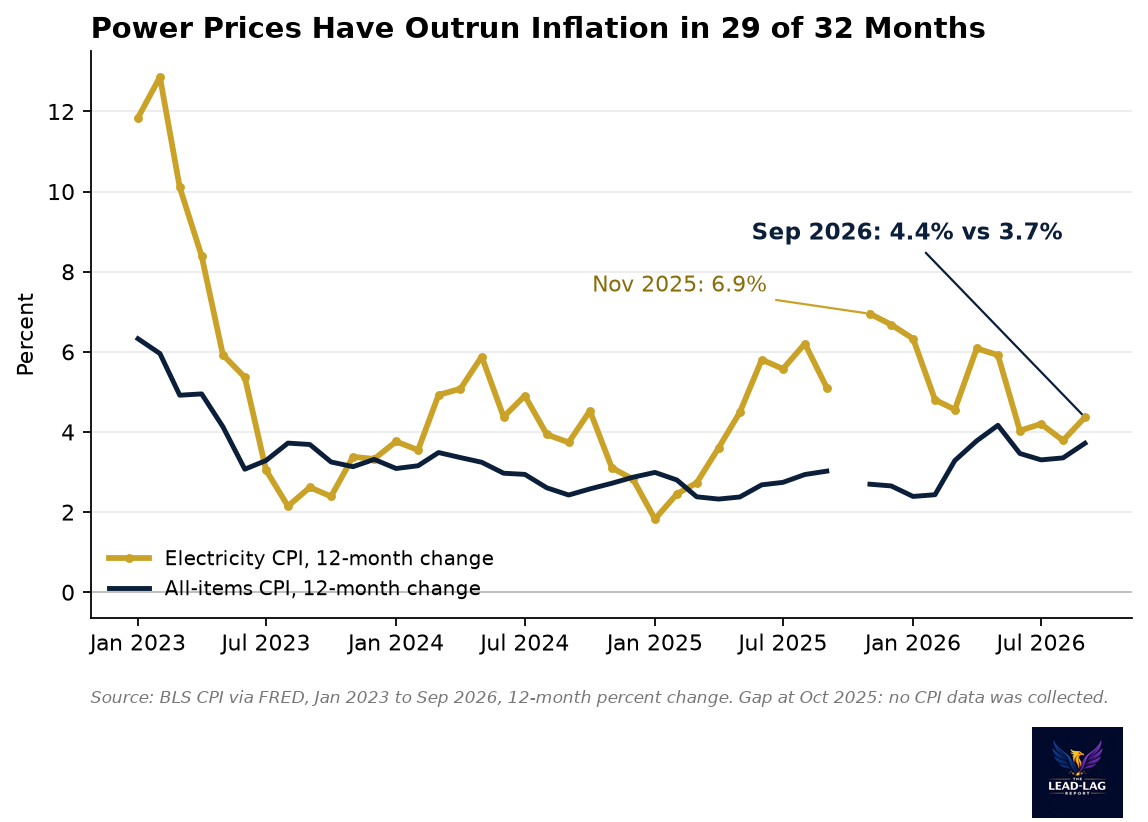
More supply has not meant cheaper power. The electricity index in the Consumer Price Index rose 4.4% in the year to September, against 3.7% for all items and 2.6% for prices excluding food and energy.[2][3][4] Since January 2021, electricity prices are up 41.8%. The overall price level is up 28.0%.[2][3]
A gap that keeps widening
The 2022 spike in electricity prices was easy to explain at the time. Natural gas, the fuel that sets the marginal price of power in much of the country, surged, and electricity inflation peaked at 15.8% in August 2022.[2] Then fuel prices eased, and by August 2023 electricity inflation fell to 2.2%, below the overall rate of 3.7%.[2][3]
It did not stay there. Starting in January 2024, electricity prices rose faster than the overall CPI in 29 of the 32 months with data, by my count from the BLS series.[2][3] The most recent peak was 6.9% in November 2025.[2] The pace has cooled since then, to between 3.8% and 4.4% over the past four months, but it remains above the headline rate.[2][3]
The average retail price of electricity tracked by BLS tells the same story in dollars. It was 13.6 cents per kilowatt-hour in January 2021, 18.8 cents in September 2025 and 19.6 cents in September 2026.[5] That is a 44% increase in under six years.
What is different this time
In 2022 the story was the price of fuel. This time, the fuel side is quieter. The CPI index for natural gas delivered to homes rose 5.0% in the year to September, down from gains of 9% to 14% between August 2025 and February 2026.[6] Electricity inflation slowed too, but much less.
That points to the parts of a power bill that do not move with fuel: the cost of the grid itself. Transmission lines, substations and distribution upgrades are paid for through regulated rates over decades. When utilities build more of them, the cost shows up in bills slowly and stays there. I cannot split the CPI number into fuel and delivery from these data, so treat that as a reading of the pattern, not a measurement.
What the data do show is demand. The output index is seasonally adjusted, so the record is not simply a summer effect, and it is rising at a pace not seen in three decades.[1] Weather moves this series from month to month, and one hot or cold month can lift it. But the annual average has risen every year since 2023, from 103.7 to 111.6 so far in 2026, rather than spiking once and falling back.[1]
Why it matters beyond the bill
Electricity makes up a small share of the CPI basket, so it does not drive the headline number on its own. But it is one of the prices households see every month on a single bill, and it shows up again in the costs of every business that runs on power. A component that has outrun overall inflation for most of three years is not noise.
It is also now a political price. On the day after the midterm elections, shares of power producers fell sharply, and Texas Governor-elect Gina Hinojosa had campaigned on a moratorium on new data centers, according to Yahoo Finance.[7] Whatever one thinks of that policy, it shows that the cost and supply of electricity have moved from utility rate cases into campaigns.
For anyone watching inflation, the useful question is not whether electricity is rising. It is whether the gap with the rest of the basket closes as fuel costs stay calm. If grid investment is the driver, the answer is likely no, and electricity will keep running ahead of headline CPI for some time. If the 2024 to 2026 surge was mostly fuel and weather, the gap should keep narrowing from here.
What to watch
The next CPI release will show whether the September reading of 4.4% was a bounce or a new leg higher, and whether natural gas prices keep easing.[2][6] The next industrial production report will show whether power output stays near its record after the summer months.[1] A record in output paired with a narrowing price gap would mean the system is adding supply fast enough. A record in output paired with a widening gap would mean it is not.
Notes
[1] Industrial Production: Electric Power Generation, Transmission and Distribution (NAICS 2211), Board of Governors of the Federal Reserve System via FRED, series IPG2211S: https://fred.stlouisfed.org/series/IPG2211S. 117.451 (Sep 2026), 107.1935 (Sep 2025); annual averages 103.7 (2023), 111.6 (Jan to Sep 2026); series begins Jan 1972.
[2] Consumer Price Index: Electricity in U.S. City Average, BLS via FRED, series CUSR0000SEHF01: https://fred.stlouisfed.org/series/CUSR0000SEHF01. 216.013 (Jan 2021), 293.388 (Sep 2025), 306.199 (Sep 2026); 12-month change 15.8% (Aug 2022), 6.9% (Nov 2025), 4.4% (Sep 2026). No October 2025 observation.
[3] Consumer Price Index for All Urban Consumers: All Items, BLS via FRED, series CPIAUCSL: https://fred.stlouisfed.org/series/CPIAUCSL. 12-month change 3.7% (Sep 2026).
[4] Consumer Price Index: All Items Less Food and Energy, BLS via FRED, series CPILFESL: https://fred.stlouisfed.org/series/CPILFESL. 12-month change 2.6% (Sep 2026).
[5] Average Price: Electricity per Kilowatt-Hour in U.S. City Average, BLS via FRED, series APU000072610: https://fred.stlouisfed.org/series/APU000072610. $0.136 (Jan 2021), $0.188 (Sep 2025), $0.196 (Sep 2026).
[6] Consumer Price Index: Utility (Piped) Gas Service in U.S. City Average, BLS via FRED, series CUSR0000SEHF02: https://fred.stlouisfed.org/series/CUSR0000SEHF02. 12-month change 13.8% (Aug 2025), 10.9% (Feb 2026), 5.0% (Sep 2026).
[7] Yahoo Finance, report on power stocks after the midterm elections, Nov. 4, 2026: https://finance.yahoo.com/markets/stocks/articles/vistra-sinks-10-constellation-down-150042182.html.
The Lead-Lag Report is provided by Lead-Lag Publishing, LLC. All opinions and views mentioned in this report constitute our judgments as of the date of writing and are subject to change at any time. Information within this material is not intended to be used as a primary basis for investment decisions and should also not be construed as advice meeting the particular investment needs of any individual investor. Trading signals produced by the Lead-Lag Report are independent of other services provided by Lead-Lag Publishing, LLC or its affiliates, and positioning of accounts under their management may differ. Please remember that investing involves risk, including loss of principal, and past performance may not be indicative of future results. Lead-Lag Publishing, LLC, its members, officers, directors and employees expressly disclaim all liability in respect to actions taken based on any or all of the information on this writing.