Oil Hit $138 This Year. The Bond Market's Long-Run Inflation Gauge Never Moved.
Brent hit $138.21 in April and fell 17.6% in three sessions this week. The 5-year, 5-year forward inflation gauge stayed between 2.05% and 2.36%.

Today's Lead-Lag Report post is sponsored by Relative Sentiment
The Relative Sentiment Tactical Allocation ETF is a flexible, multi-asset fund that invests across stocks, bonds, commodities, precious metals, and currencies. Its approach is guided by a research-based factor called relative sentiment — which tracks how optimistic or cautious professional investors are compared to individual investors. Studies show professionals tend to have an edge over time, and this ETF seeks to capture that insight by increasing exposure to areas where institutions are more optimistic and reducing exposure where they're more cautious. Relative sentiment often complements trend-following strategies, helping create portfolios that may be more balanced and less prone to sharp swings.
The Fund's investment objectives, risks, charges and expenses must be considered carefully before investing. This and other important information is contained in the Prospectus and SAI, which may be obtained by following the links or by calling +1.215.882.9983. Please read the prospectus carefully before investing.
Investments involve risk. Principal loss is possible.
The Fund is distributed by PINE Distributors LLC.
ETFAC-4976143-11/25
DISCLAIMER – PLEASE READ: This is sponsored advertising content for which Lead-Lag Publishing, LLC has been paid a fee. The information provided in the link is solely the creation of Relative Sentiment. Lead-Lag Publishing, LLC does not guarantee the accuracy or completeness of the information provided in the link or make any representation as to its quality. All statements and expressions provided in the link are the sole opinion of Relative Sentiment. and Lead-Lag Publishing, LLC expressly disclaims any responsibility for action taken in connection with the information provided in the link.
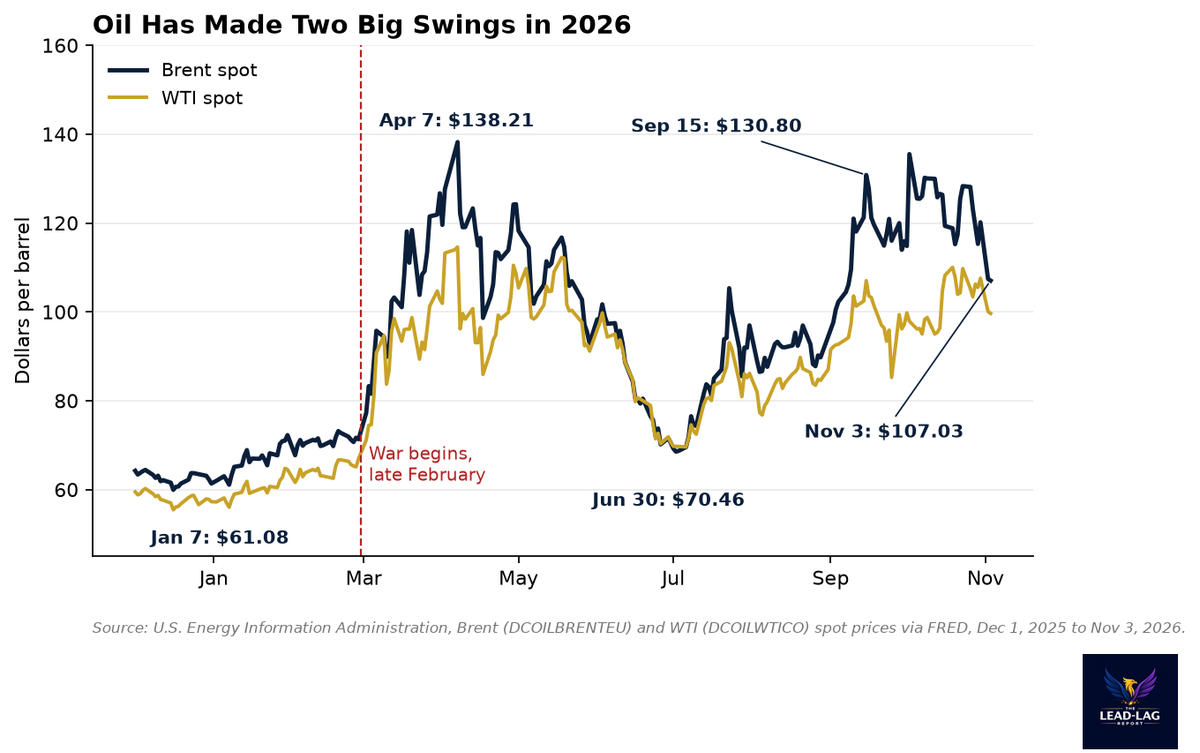
Brent more than doubled by April, gave it all back by June and has swung between $70 and $131 since. The bond market's long-run inflation gauge never left a 31-basis-point range.
MICHAEL A. GAYED, CFA
Key Highlights
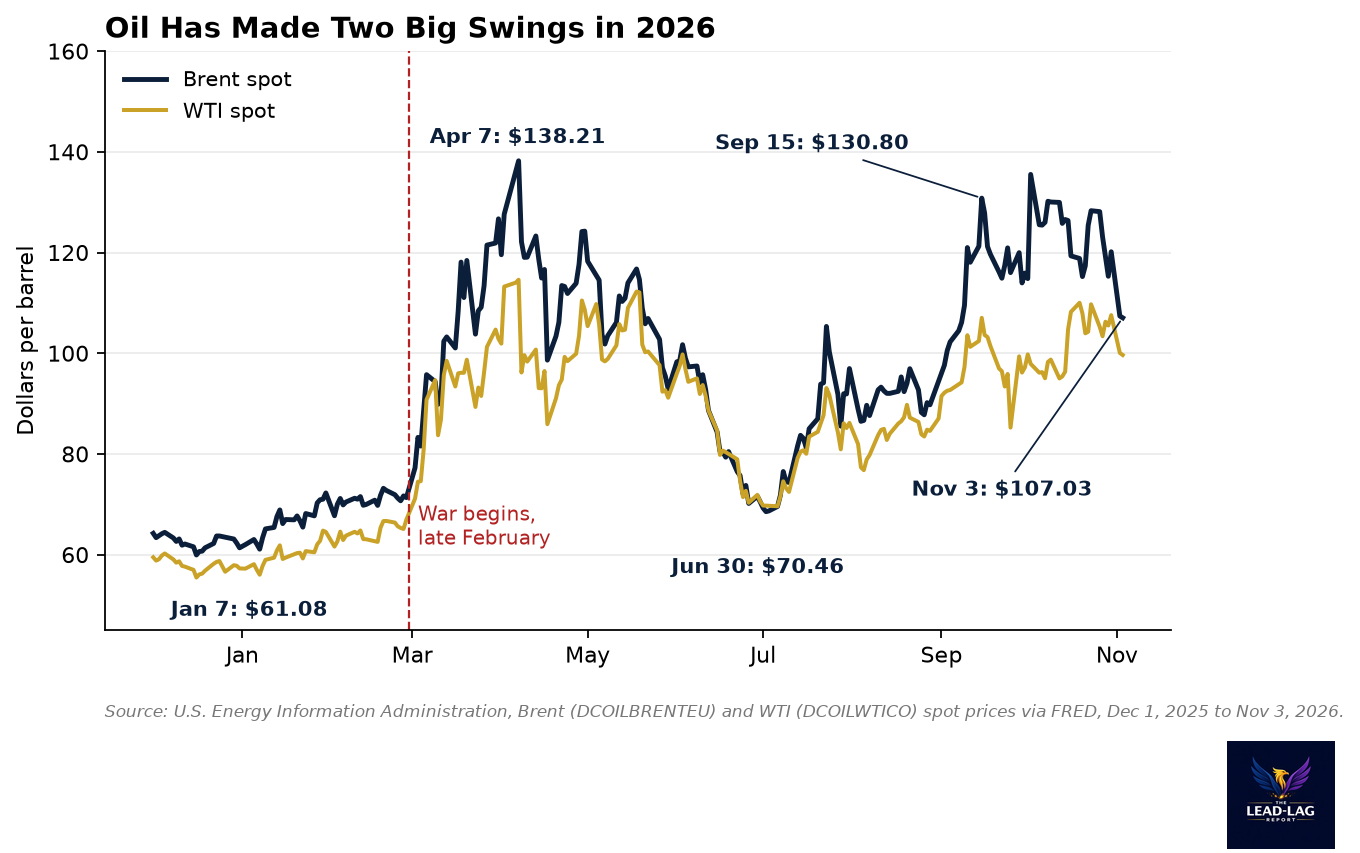
- Brent spot rose from $61.08 on Jan. 7 to $138.21 on April 7, fell to $70.46 by June 30, climbed back to $130.80 on Sept. 15 and was $107.03 on Nov. 3.1
- Brent's January futures contract fell from $113.43 on Oct. 30 to a $93.52 settlement on Nov. 4, a 9.73% drop on the day after the midterms.6, 7
- The 5-year, 5-year forward inflation expectation has stayed between 2.05% and 2.36% all year and was 2.22% on Nov. 4.8
- The University of Michigan's one-year inflation expectation went from 3.4% in February to 4.8% in May and was 4.6% in September.10
- The oil fund USO is up 110.9% this year, but the energy sector ETF XLE is up 39.1%, against 12.2% for the S&P 500.13
Two Big Swings in Ten Months
I have watched a lot of oil cycles. I have not seen one like 2026. Brent crude started the year at $61.08 a barrel on Jan. 7, the low of the year.1 Fighting between the U.S., Israel and Iran began in late February and halted most shipping through the Strait of Hormuz, the waterway that carried roughly a fifth of the world's oil before the conflict.3 By April 7, Brent spot was $138.21.1
Then it all came back. By June 30, Brent was $70.46, almost exactly where it had been before the war.1 The Energy Information Administration has pointed to lower Chinese crude imports since April as one reason, since they absorbed some of the supply loss.5 Then it went up again. Attacks on Saudi Arabia's East-West pipeline, the main route around Hormuz, sent the daily Brent spot price as high as $131 on Sept. 15, and Brent averaged $114 for the month of September.4 The EIA also noted that releases from the U.S. Strategic Petroleum Reserve slowed significantly in September, removing one of the buffers that had helped earlier in the year.5
West Texas Intermediate, the U.S. benchmark, followed the same path at a lower level: $56.01 on Jan. 7, $114.58 on April 7 and $99.64 on Nov. 3.2
The last week has been its own small version of the year. Brent's January futures contract closed at $113.43 on Oct. 30.6 On Nov. 2 it fell 7.63% to $104.77 as hopes for U.S.-Iran peace talks grew.6 On Nov. 4, the day after Democrats won both chambers of Congress, it settled at $93.52, down $10.08, or 9.73%, on the day.7 That is a decline of about 17.6% in three trading sessions, by my calculation from those settlements.
I am not going to tell you where oil goes next. Nobody knows how the war ends, and anyone who says otherwise is guessing. What I can do is look at how different markets have priced the same shock, because they have priced it in remarkably different ways.
The Bond Market Never Panicked
The cleanest market read on long-run inflation is the 5-year, 5-year forward inflation expectation rate. It uses Treasury and inflation-protected Treasury yields to back out the inflation rate investors expect over the five years that begin five years from now. It is designed to look past today's oil price.
It has done exactly that. On Jan. 7, with Brent at $61, the 5-year, 5-year forward rate was 2.24%.1, 8 On April 7, with Brent at $138, it was 2.13%.8 It was lower at the peak of the oil shock than at the start of the year. Its full range in 2026 has been 2.05%, on March 30, to 2.36%, on Sept. 23.8 On Nov. 4 it was 2.22%.8
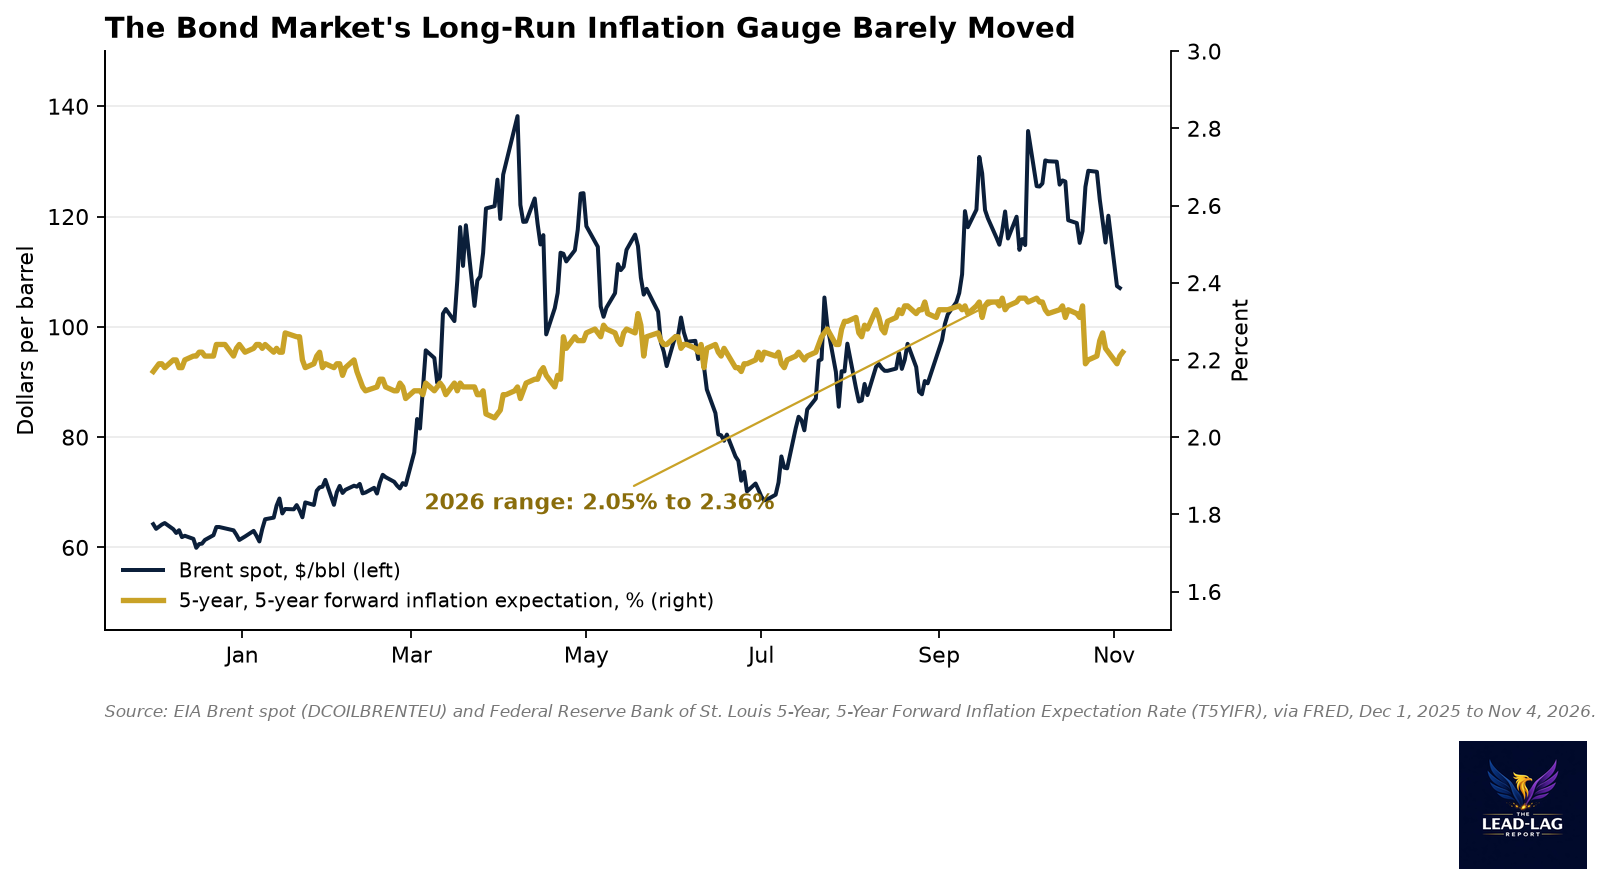
The 10-year breakeven inflation rate, which includes the near years and so should be more sensitive to oil, moved more but not much more. It was 2.27% on Jan. 7, 2.37% on April 7 and 2.26% on Nov. 4, with a 2026 range of 2.18% to 2.50%.9
Think about what that means. Oil more than doubled in three months, and the market's 10-year inflation estimate rose by 10 basis points. The long-run estimate fell. Bond investors have treated this as a supply shock that will pass, not as a change in the inflation regime.
I think that is the most important fact about the oil market this year, and it gets almost no attention. When people worry that an oil spike will become the next inflation wave, this is the gauge to watch. It has not blinked.
Households Did Blink
Consumers are not pricing oil off futures curves. They are pricing it at the pump.
Regular gasoline averaged $2.796 a gallon in the week of Jan. 5.11 It peaked at $4.50 in the week of May 11.11 In the week of Nov. 2 it was $4.153, compared with $3.019 a year earlier.11
The University of Michigan's survey of one-year inflation expectations moved almost in lockstep. It was 3.4% in February, before the war's effect reached gas stations.10 It jumped to 4.7% in April and 4.8% in May.10 It eased to 4.0% in August as gasoline came down, then rose back to 4.6% in September as prices climbed again.10
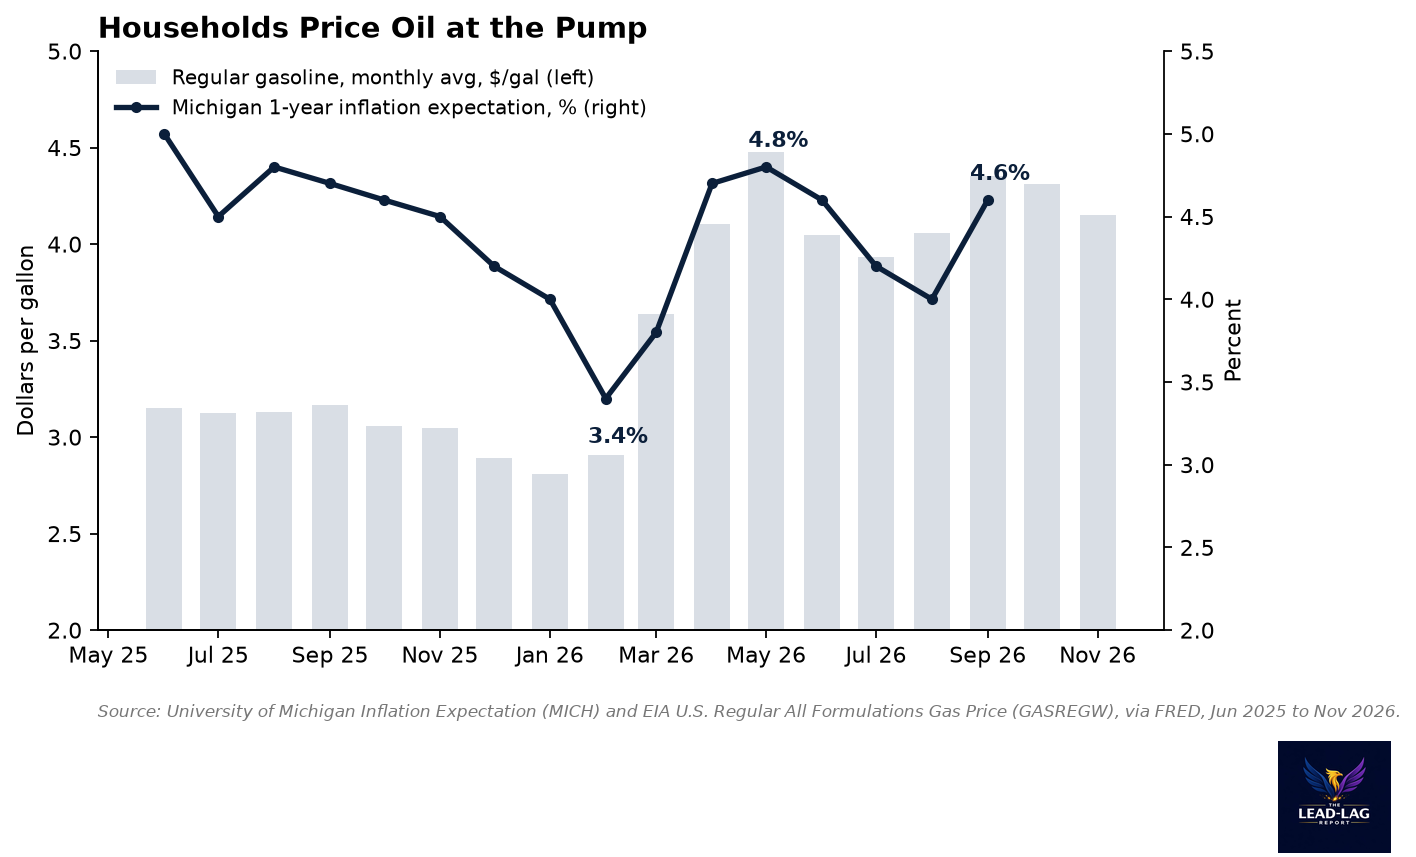
That pattern is not irrational. A household's inflation is the price of what it buys every week, and gasoline is one of the few prices people see posted in large numbers on every corner. When gas rises a dollar and a half, it feels like inflation, because for that household it is.
But it means two very different signals are coming from the same shock. The bond market says the shock will fade. Households say they expect prices to keep rising faster over the next year. Policymakers have to decide which one to listen to, and history gives them a reason to watch both. Long-run expectations are stable until they are not, and household expectations that stay high for long enough can start to shape wage demands and pricing.
Where the Risk Premium Lives
One reason oil has stayed high even when barrels have kept moving is what traders call a risk premium. Daan Struyven, head of oil research at Goldman Sachs, estimated that about $25 of the price per barrel represents that premium, the compensation buyers demand for the chance that fighting damages more infrastructure or blocks more shipments.12 He also pointed to near-record-low global inventories, as countries that drew down reserves during the disruption now rebuild them.12
A risk premium is the part of a price that can vanish quickly, and the past week showed it. Nothing changed on the water between Oct. 30 and Nov. 4 that would remove 17% of supply risk. What changed was the market's estimate of the odds of peace talks and, after the election, of the policy path that follows.6, 7
That is why I think the 5-year, 5-year forward rate has been so calm. If a large share of the price is a premium tied to an event, the bond market is right to discount it over a five-to-ten-year horizon. A war premium is not a permanent cost of producing a barrel.
Energy Stocks Never Believed It Either
Equity investors have taken a position close to the bond market's. From Jan. 2 to Nov. 4, the oil fund USO rose 110.9%, while the Energy Select Sector SPDR, XLE, rose 39.1% and SPY, the S&P 500 fund, rose 12.2%.13
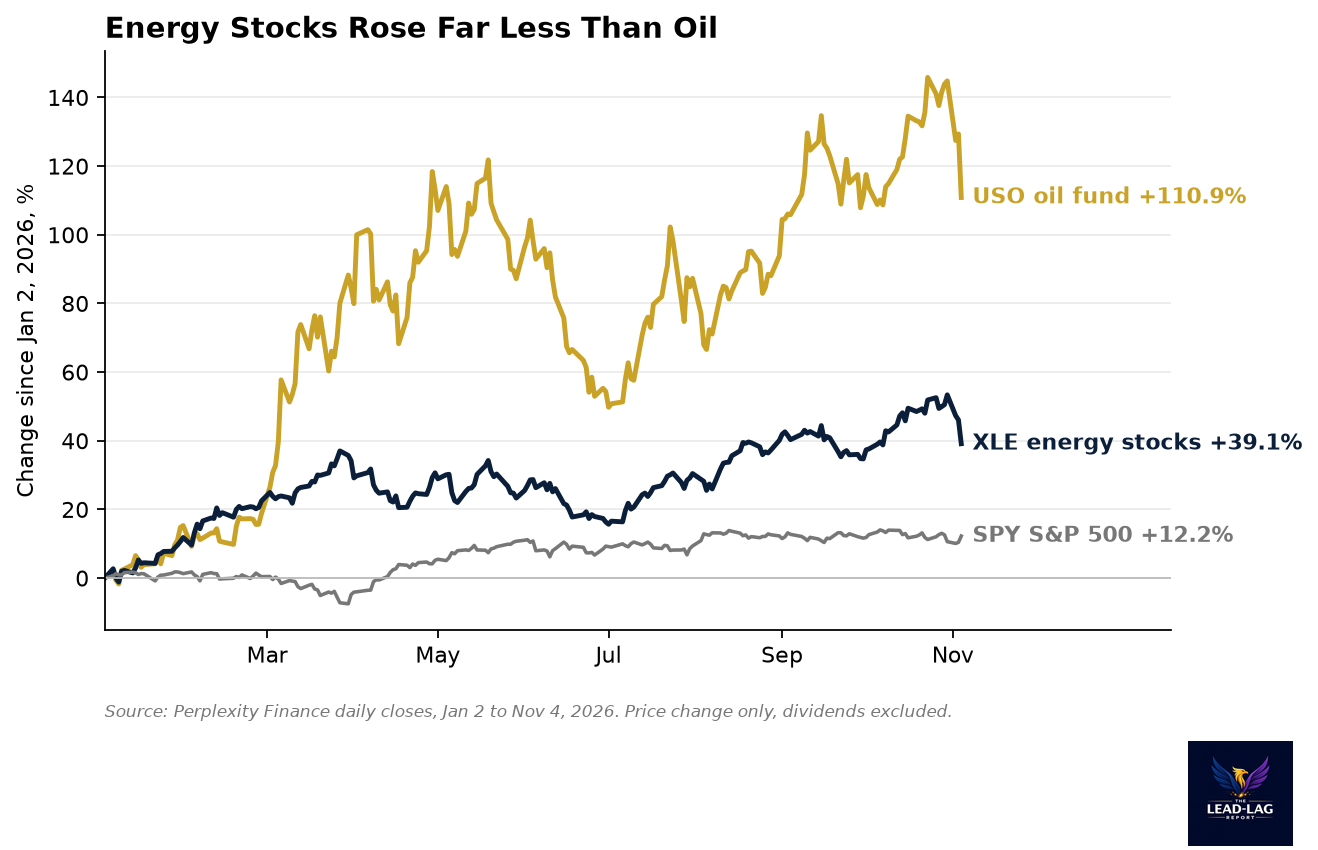
Energy stocks did well, but they captured about a third of oil's move. That is what you would expect if investors were valuing producers on oil prices several years out rather than on the spot price. Producers are worth the cash they generate over decades, and the market does not appear to believe that $100 oil lasts for decades.
The past week fits that reading too. From Oct. 30 to Nov. 4, USO fell 13.9% and XLE fell 9.3%, while SPY rose 1.5%.13 When the premium came out of oil, it came out of energy stocks, though by less, and the broad market did not care.
What This Means for Inflation
Oil feeds into measured inflation fast and directly through gasoline, and more slowly through transportation and goods prices. That pass-through is real, and it is why the household survey matters.
But the long-run market gauge is what tells you whether that pass-through is expected to become persistent. Today it says no. The 5-year, 5-year forward rate is roughly where it was before the war began, 2.10% on Feb. 27 and 2.22% on Nov. 4.8 The highest reading since the start of 2024 was 2.46% on July 19, 2024, well before any of this.8
In plain terms, the bond market has been more worried about inflation in a calm oil market than it is now in a war.
What Would Change My Mind
I could be wrong in a few specific ways, and I want to name them.
First, if the 5-year, 5-year forward rate moved above its 2024 high of 2.46% while oil stayed high, I would take it as a sign that long-run expectations are starting to drift.8 That has not happened in 2026.
Second, if the Michigan one-year expectation stayed near 4.5% or higher even as gasoline fell, it would suggest households were no longer reading inflation off the pump alone.10, 11 So far, the survey has followed gasoline down as well as up.
Third, if the premium Struyven describes turned out to be a permanent supply loss rather than a temporary risk, the bond market would be underpricing it. The EIA has described flows that are disrupted and only partly rerouted, which is a reminder that a premium can become a shortage.4, 5
What I Am Watching
The next weekly gasoline print, to see whether pump prices follow futures lower after the drop of the past week.11
The next Michigan survey, for whether the one-year expectation eases with gasoline as it did in August.10
The 5-year, 5-year forward rate, daily, for any move toward 2.46%.8
And the gap between oil and energy stocks. If XLE starts to track USO more closely, it would mean investors are beginning to believe high prices last.13
Oil this year has been a reminder that the loudest price is not always the most informative one. The barrel told one story. The bond market told another, and so far it has been right.
Notes
- [1] Brent crude spot price, U.S. Energy Information Administration via FRED, series DCOILBRENTEU: fred.stlouisfed.org/series/DCOILBRENTEU . $61.08 (Jan 7), $72.75 (Feb 20), $138.21 (Apr 7), $70.46 (Jun 30), $130.80 (Sep 15), $120.15 (Oct 30), $107.03 (Nov 3, 2026).
- [2] WTI crude spot price, U.S. Energy Information Administration via FRED, series DCOILWTICO: fred.stlouisfed.org/series/DCOILWTICO . $56.01 (Jan 7), $114.58 (Apr 7), $107.56 (Oct 30), $99.64 (Nov 3, 2026).
- [3] Associated Press, as published by the Butler Eagle, "Oil surges above $100 a barrel as US and Iran launch new attacks": www.butlereagle.com/20260909/oil-rises-past-100-a-barrel-after-the-latest-wave-of-middle-east-attacks/
- [4] U.S. Energy Information Administration, Short-Term Energy Outlook, global oil markets, Oct. 13, 2026: www.eia.gov/outlooks/steo/report/global_oil.php
- [5] U.S. Energy Information Administration, Today in Energy, crude oil prices and refinery margins in 3Q26, Oct. 26, 2026: www.eia.gov/todayinenergy/detail.php?id=68245
- [6] EBC Financial Group, Brent January 2027 futures close of $113.43 on Oct. 30 and $104.77 on Nov. 2, 2026: www.ebc.com/forex/oil-prices-biggest-drop-since-july-2026 ; Jiji Press, Nov. 2 decline on peace-talk hopes: jen.jiji.com/jc/eng_agt?g=nation&k=20261103NATION-40073041
- [7] Admiral Markets, citing FinanceFeeds, Brent January 2027 settlement of $93.52 on Nov. 4, 2026, down $10.08 or 9.73%: admiralmarkets.com/analytics/traders-blog/brent-crude-oil-price-after-midterms
- [8] 5-Year, 5-Year Forward Inflation Expectation Rate, Federal Reserve Bank of St. Louis via FRED, series T5YIFR: fred.stlouisfed.org/series/T5YIFR . 2.24% (Jan 7), 2.10% (Feb 27), 2.13% (Apr 7), 2.35% (Sep 15), 2.22% (Nov 4, 2026); 2026 low 2.05% (Mar 30), high 2.36% (Sep 23); high since Jan 2024 2.46% (Jul 19, 2024).
- [9] 10-Year Breakeven Inflation Rate, Federal Reserve Bank of St. Louis via FRED, series T10YIE: fred.stlouisfed.org/series/T10YIE . 2.27% (Jan 7), 2.37% (Apr 7), 2.26% (Nov 4, 2026); 2026 range 2.18% to 2.50%.
- [10] University of Michigan, Inflation Expectation, via FRED, series MICH: fred.stlouisfed.org/series/MICH . 3.4% (Feb), 4.7% (Apr), 4.8% (May), 4.0% (Aug), 4.6% (Sep 2026).
- [11] U.S. Regular All Formulations Gas Price, U.S. Energy Information Administration via FRED, series GASREGW: fred.stlouisfed.org/series/GASREGW . $2.796 (week of Jan 5), $4.50 (week of May 11), $4.153 (week of Nov 2, 2026); $3.019 (week of Nov 3, 2025).
- [12] Investopedia, Oct. 16, 2026, citing Daan Struyven, head of oil research at Goldman Sachs: www.investopedia.com/oil-is-getting-through-from-the-middle-east-heres-why-prices-are-still-high-12177905
- [13] Perplexity Finance daily closes for USO, XLE and SPY, Jan 2 to Nov 4, 2026, price change only: www.perplexity.ai/finance/XLE