T-Bills Yield More Than the Fed's Ceiling. The Fed Usually Follows.
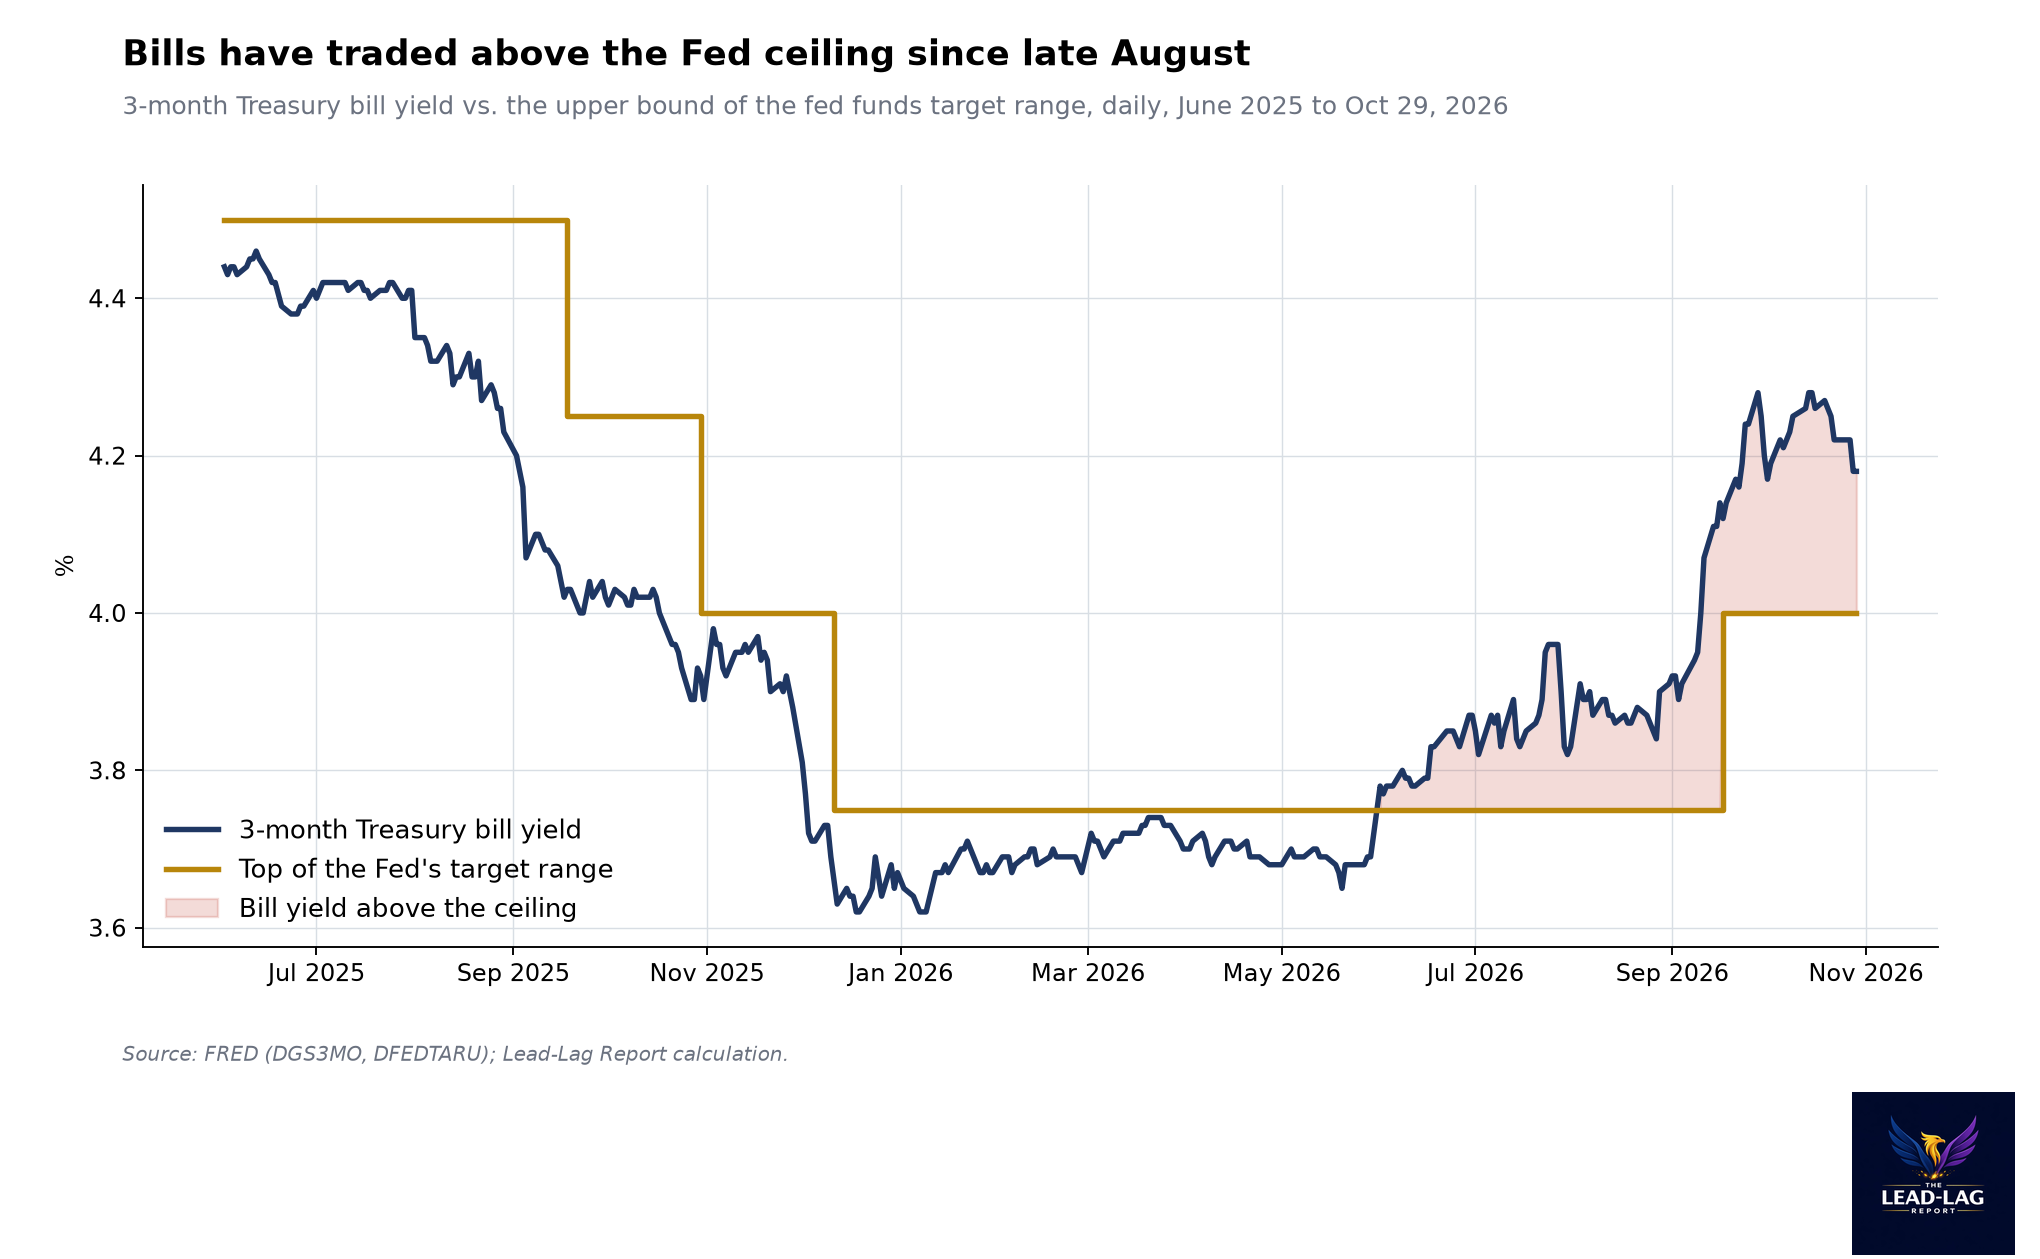
The 3-month bill yields 4.18%, above the Fed's 4.00% ceiling. In 37 of 45 similar episodes since 1990, the Fed hiked within about three months.

Today’s Lead-Lag Report post is sponsored by SanJac Alpha
A smarter approach to fixed income investing
SanJac Alpha offers actively managed fixed income ETFs designed to pursue opportunities while also managing risk across today’s fixed income landscape.
The SanJac Alpha Low Duration ETF (SJLD) seeks current income and capital preservation through short-term, high-grade credit markets.
The SanJac Alpha Core Plus Bond ETF (SJCP) seeks to maximize total returns while maintaining a moderate risk profile by providing exposure to a diverse range of Treasury, Agency, and Investment-Grade Bonds, Mortgage-Backed Securities (MBS), mREITs, and Preferred Stocks. Seeks to maximize total return while balancing risk by providing exposure to a broad range of bond products with a bias toward high-grade credits.
Markets change. Volatility is here.
It’s time for active management.
IMPORTANT INFORMATION
SanJac Alpha offers two exchange-traded funds. The funds’ investment objectives, risks, and expenses must be considered carefully before investing. The prospectus contains this and other important information about the investment company. Please read it carefully before investing. A copy of the prospectus can be found by visiting www.sanjacalpha.com or by calling 1-800-617-0004.
Investing involves risk, including loss of principal.
ETFs are subject to additional risks that do not apply to conventional mutual funds, including the risks that the market price of an ETF’s shares may trade at a premium or discount to its net asset value, an active secondary trading market may not develop or be maintained, or trading may be halted by the exchange in which they trade, which may impact an ETF’s ability to sell its shares.
Shares of any ETF are bought and sold at market price (not NAV) and are not individually redeemed from the ETF. Brokerage commissions will reduce returns.
The SanJac Alpha exchange-traded funds are distributed by Quasar Distributors, LLC.
DISCLAIMER – PLEASE READ: This is sponsored advertising content for which Lead-Lag Publishing, LLC has been paid a fee. The information provided in the link is solely the creation of SanJac Alpha. Lead-Lag Publishing, LLC does not guarantee the accuracy or completeness of the information provided in the link or make any representation as to its quality. All statements and expressions provided in the link are the sole opinion of SanJac Alpha, and Lead-Lag Publishing, LLC expressly disclaims any responsibility for action taken in connection with the information provided in the link.
The 3-month Treasury bill yields 4.18%, above the 4.00% top of the Fed's target range. Bills have traded above that ceiling for two months. Since 1990, the Fed has followed the bill market with a hike in most cases like this, and the exceptions say a lot about where we are now.
MICHAEL A. GAYED, CFA
Key Highlights
- The 3-month Treasury bill yielded 4.18% on October 29, 18 basis points above the 4.00% upper bound of the fed funds target range.1, 2
- The bill has been 10 or more basis points above the ceiling on every trading day since August 28, and on 80 of the 208 trading days so far in 2026.1, 2
- In 45 episodes from 1990 to 2025 where bills traded at least 10 basis points over the Fed's ceiling for five or more trading days, the Fed hiked within about three months 37 times, held 6 times and cut twice, by my calculation.1, 2, 3
- Traders were pricing about a 75% chance of a December hike on October 30, according to CME FedWatch as reported by Reuters.5
The Market Already Raised Rates
The Federal Reserve held its target range at 3.75% to 4% on October 28, with two officials voting for a quarter-point hike.4 Most coverage treated that as a pause. The bill market did not. On October 29 the 3-month Treasury bill yielded 4.18%, which is 18 basis points above the top of the Fed's range.1, 2 Investors lending to the government for three months are demanding more than the Fed's own ceiling. They are pricing a hike before the bill matures.
My view is that this is the most reliable signal in the rates market right now, and that it points to one more hike, probably in December. History supports that view in most cases. The real question is whether 2026 looks like the cases where the Fed followed the bill market, or like the few where it did not.
The gap is not new. The bill moved above the ceiling in July, then again in August, and it has stayed at least 10 basis points over it on every trading day since August 28.1, 2 Before the Fed's September 17 hike, the gap reached 39 basis points on September 16. The hike closed most of it, from 3.75% to 4.00% at the top of the range, and the bill market then rebuilt a premium on top of the new ceiling within days.1, 2
What Bills Above The Ceiling Usually Mean
To test how often the bill market is right, I went back to 1990. I defined an episode as five or more consecutive trading days with the 3-month bill at least 10 basis points above the Fed's target, or above the upper bound of the target range after December 2008, when the Fed moved to a range. Between 1990 and 2025 there were 45 such episodes.1, 2, 3
In 37 of the 45, the Fed raised its target within about three months of the start of the episode. In six it held. In two, both in March 1992, it cut.1, 2, 3 That is an 82% hit rate for the simple rule that the Fed follows bills that trade above its ceiling.
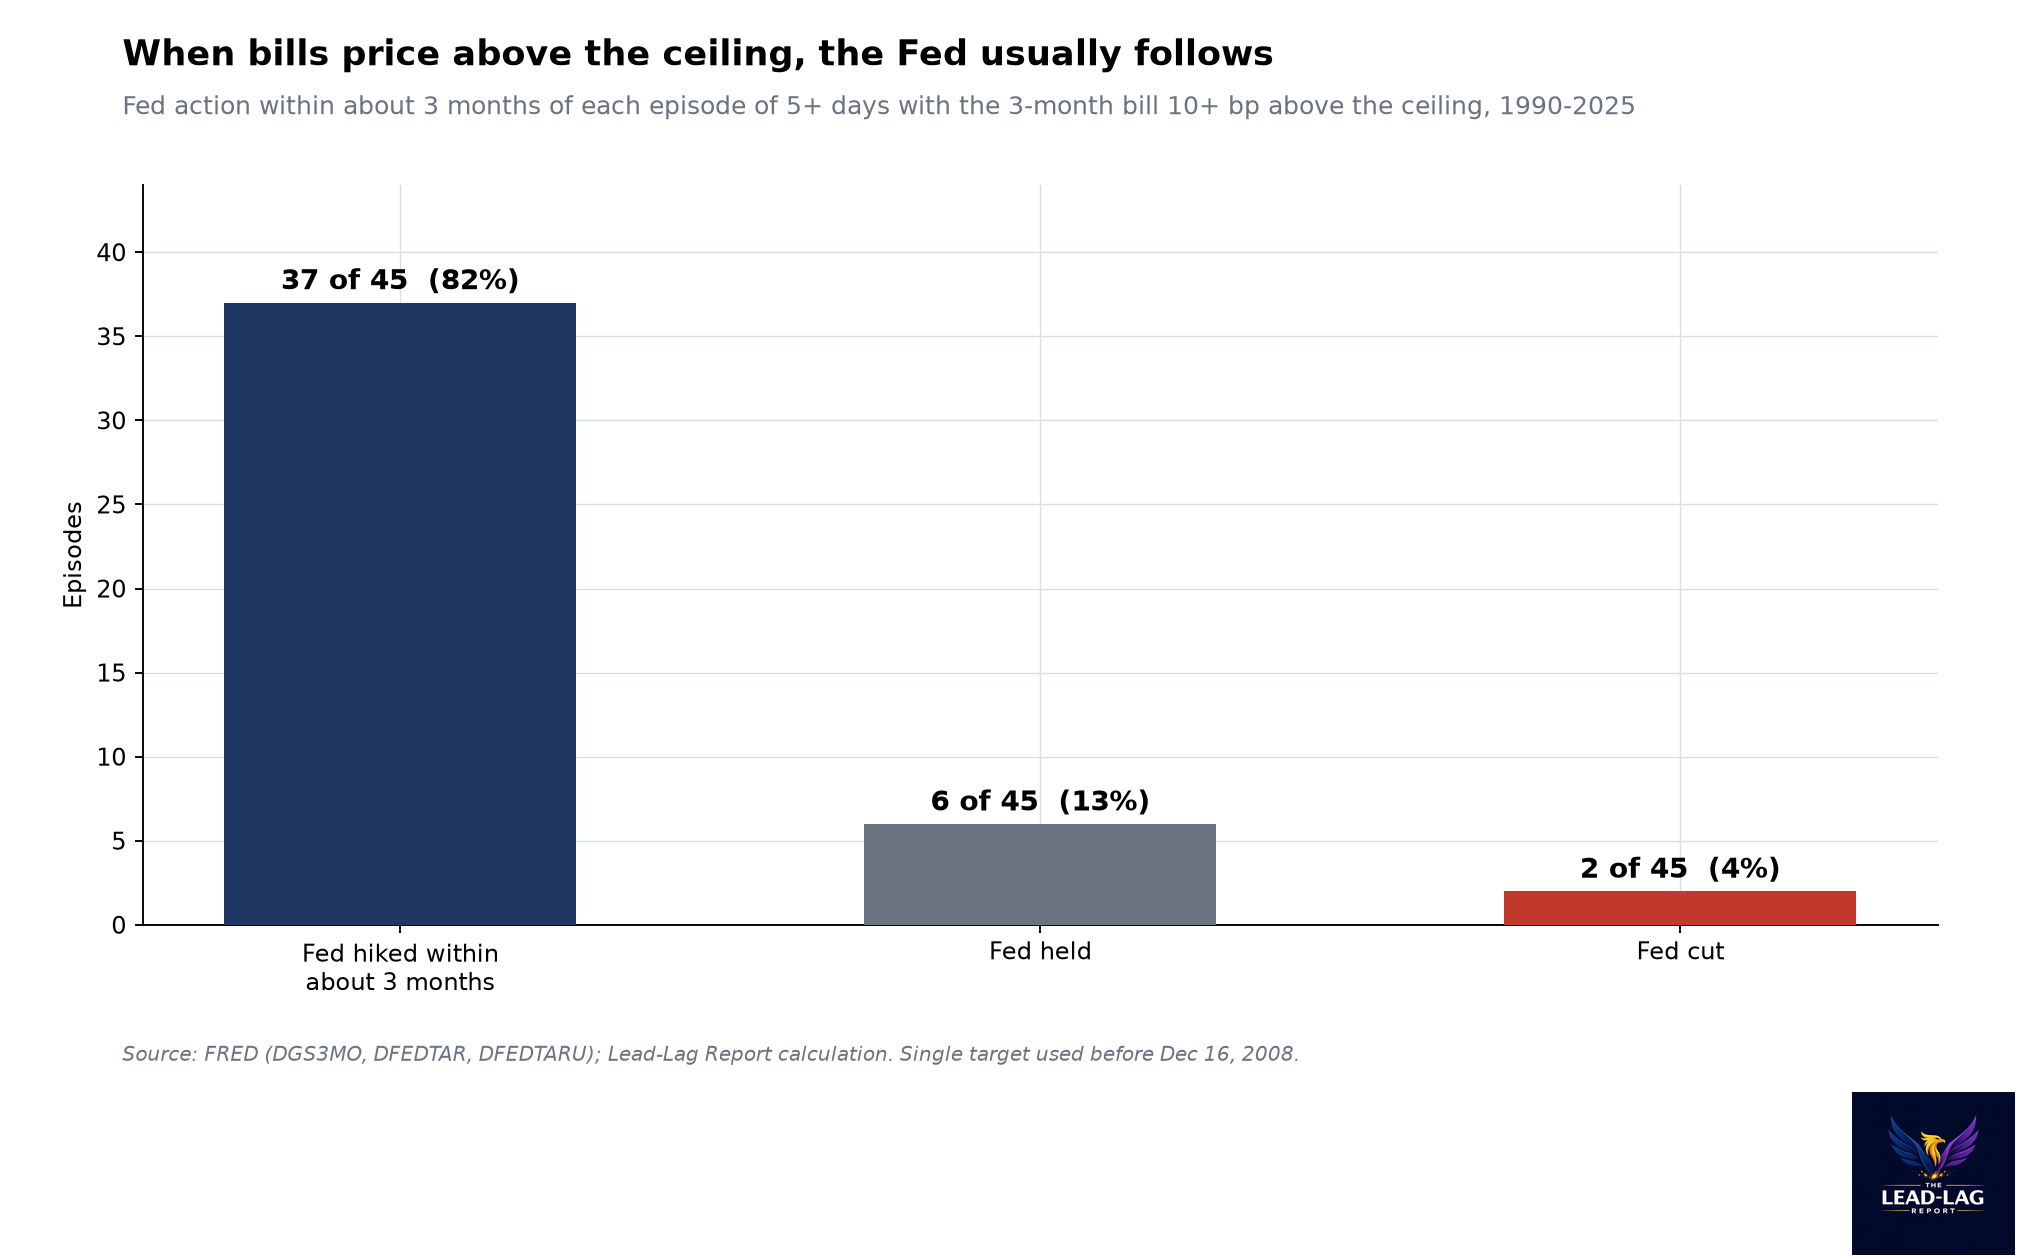
The 37 hikes cluster in the classic tightening cycles: 1994, 2004 to 2006, 2018 and 2022 to 2023.1, 2, 3 In each of those, the bill market pushed above the ceiling ahead of each step, and the Fed then confirmed it. That is the pattern of the last three months. Bills priced the September hike before it came, and they are pricing the next one now.
The misses matter more than the hits, though. Five of the six "held" cases came in 1992 and 1993, when the Fed kept its target at 3% for a long stretch while bills traded above it. The sixth was October 2023. Bills traded above the 5.50% ceiling for 12 trading days that month, and the Fed never raised rates again.1, 2 The July 2023 hike turned out to be the last of the cycle. October 2023 is the case to keep in mind, because it is the one where the bill market was pricing one more hike right at the end of a cycle.
How Long This Signal Has Lasted
The length of the current run stands out. As of October 29, the bill had been at least 10 basis points over the ceiling for 43 consecutive trading days, starting August 28.1, 2 Since 1990, only one run was longer: 50 trading days starting October 3, 2022. One other run matched it at 43 days, starting November 6, 1992.1, 3
Those two comparisons point in opposite directions, which is why I find them useful. In the 2022 run, the Fed was in the middle of a rapid tightening cycle. The ceiling was 3.25% when that run started, 4.50% about three months later and 5.50% a year later.2 In the 1992 run, the Fed's target was 3% when the run started and it was still 3% more than a year later.3 Bills that traded above the Fed for two months in 1992 were wrong. Bills that did so in 2022 understated what was coming.
The other big cycles fit the 2022 template. When bills pushed above the ceiling in February 1994, the target was 3.25%. Three months later it was 4.25%, and a year later it was 6.00%. In June 2004 the target was 1.00%, then 1.50% three months later and 3.00% a year later. In February 2018 it moved from 1.50% to 1.75% in three months and 2.50% in a year.2, 3 In each case, bills trading above the ceiling marked the early or middle stage of a cycle, not the end.
So the length of the run does not settle the debate by itself. What separates 1992 from 2022 is the inflation backdrop and how the Fed responded to it, and that is where I think 2026 looks much more like the hiking cycles than like the long hold of the early 1990s.
Why I Think This Is Not October 2023
Three things look different from October 2023.
The first is the inflation impulse. In October 2026, Brent crude for December settled at $117.64, up 13.6% for the month, as tankers were attacked in the Strait of Hormuz.11 Reuters reported that U.S. inflation accelerated in September as consumers paid more for gasoline, and that GDP grew more than expected in the third quarter.6 That is a backdrop where a hawkish committee has a reason to act, not a reason to wait.
The second is the committee itself. Two voters dissented for a hike on October 28.4 Dissents in the hawkish direction at a hold are the clearest sign that the debate is about whether to move, not whether to cut.
The third is the global setting. The European Central Bank held at 2.50% on October 29, but three policymakers told Reuters a December 17 hike was all but certain barring a collapse in energy prices.12 When central banks are moving in the same direction, a single bank stopping early becomes harder, because its currency and its bond market carry the cost.
The Curve Is Telling The Same Story
The whole Treasury curve now sits above the Fed's ceiling. On October 29 the 2-year yielded 4.61%, the 10-year 4.98% and the 30-year 5.32%.7, 8, 9 On January 2, when the ceiling was 3.75%, the 2-year was at 3.47%, below the funds rate, which is how markets signal expected cuts.7, 2 The 2-year has risen 114 basis points this year and now trades 61 basis points over the ceiling.7, 2
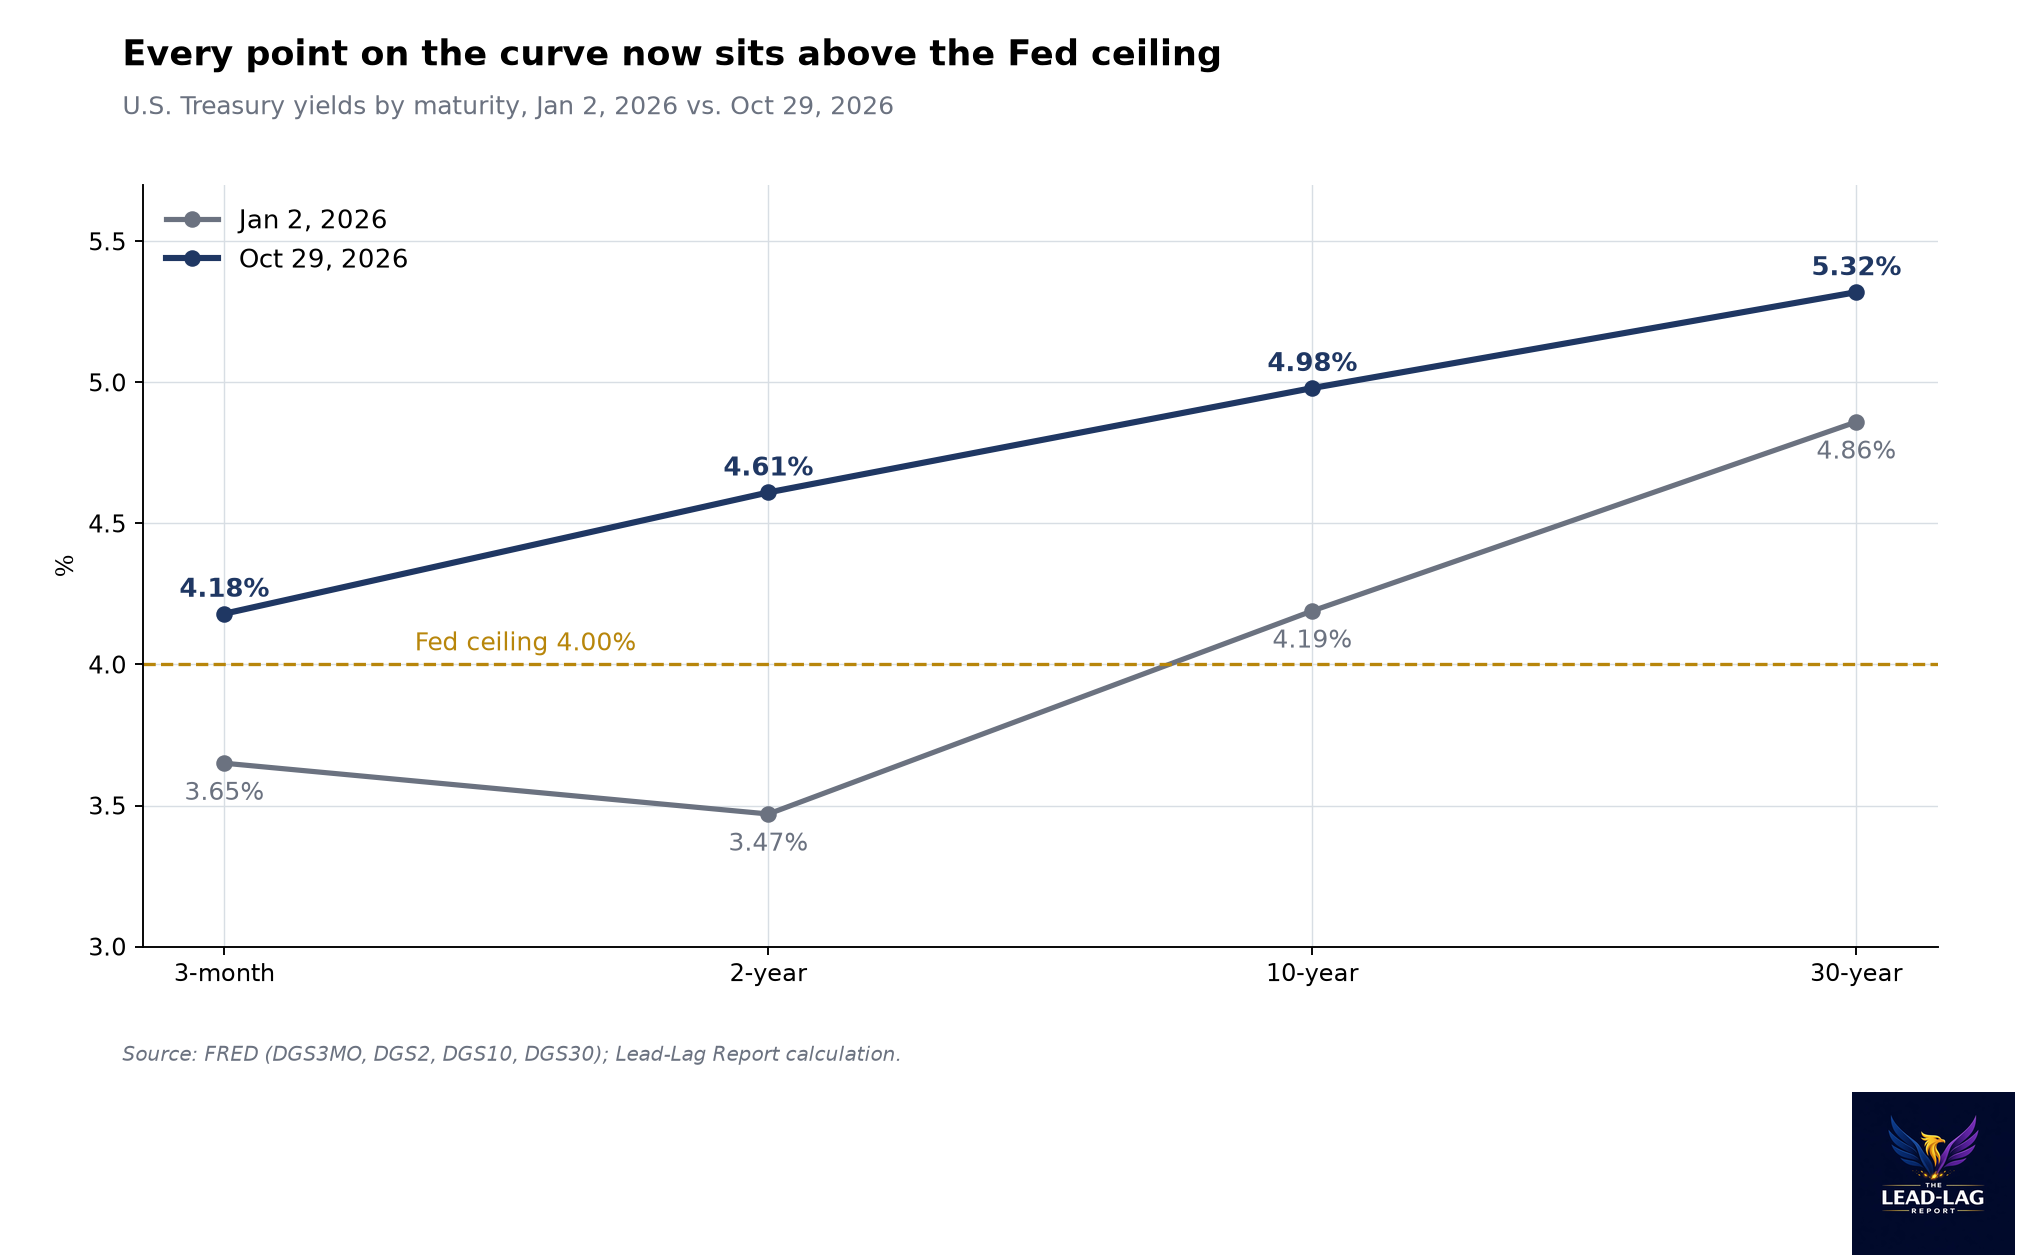
The shape matters too. The gap between the 10-year and 2-year yields was 38 basis points on October 30, and the gap between the 10-year and the 3-month bill was 78 basis points.13, 14 A positive slope with the short end above the policy rate is the market's way of saying that rates go higher first, and that it wants extra pay for lending long while that happens. This is not the deeply inverted curve of 2023 that priced a quick reversal.
The 10-year yield did come down in October, from 5.29% on September 30 to 4.98% on October 29.8 Part of that was a flight to safety during the selloff in chip stocks. The Nasdaq Composite fell 2.86% on October 30, its largest one-day percentage drop since June 5, and the chip index lost 7.2% that day.10 But the bill yield barely moved during that rally, from 4.20% at the end of September to 4.18%.1 The long end was reacting to growth risk. The short end was still pricing policy.
What This Means For Income Investors
For anyone holding cash or short-term bonds, the message is straightforward. The front end of the curve is paying more than the Fed's ceiling, with very little interest rate risk. A 3-month bill at 4.18% pays almost as much income as the 10-year did at the start of the year, when it yielded 4.19%.1, 8 If the Fed does hike in December, short instruments roll into the higher rate within weeks.
Duration is a different bet. A 10-year Treasury at 4.98% pays 80 basis points more than the bill, but its price falls when yields rise.8, 1 If the bill market is right and the Fed hikes again, the most likely damage is to longer bonds that have rallied on the October growth scare. If the bill market is wrong, as it was in October 2023, longer bonds are the ones that benefit.
I would not frame that as a choice between cash and bonds. It is a question of how much of a bond sleeve depends on the Fed being finished. In my view, the bill market is saying the Fed is not finished, and the base rate says that view usually wins.
The Case Against Me
The strongest argument against this view is the selloff in technology stocks. The Nasdaq Composite finished October 30 7.8% below its October 6 record close, as AI spending worries hit Intel and Amazon.10 If the equity drawdown turns into a broader tightening of financial conditions, the Fed may decide that markets have done the tightening for it. In Europe, ECB estimates circulated before the October meeting showed that the recent rise in bond yields would lower growth and inflation in 2027 and 2028.12
The second argument is that bills can trade above the ceiling for technical reasons. Heavy Treasury bill issuance, money market fund flows and quarter-end or year-end funding pressures can all push bill yields up without any change in policy expectations. My measure does not separate those effects from rate expectations. The 1992 and 1993 episodes in my sample, when the Fed held for months while bills stayed above its target, show that the signal can be noisy.1, 3
The third argument is the falling 10-year yield itself. A 31 basis point drop in a month is a meaningful vote that the market expects slower growth.8 If that drop extends, the front end will eventually follow.
What Would Change My View
I am watching three things. First, if the 3-month bill falls back below 4.00% before the Fed's December meeting, the market has stopped pricing the hike and my read is wrong.1, 2
Second, if CME FedWatch odds of a December hike fall below 50% from the roughly 75% reported on October 30, that would tell me the committee is signaling a longer pause.5
Third, if the Fed holds in December while bills stay 10 or more basis points over the ceiling, 2026 joins October 2023 as a case where the bill market priced one more hike than the Fed delivered. I would treat that as a sign the tightening cycle is over.1, 2
How This Fits What I Have Written
This piece builds on two recent Macro Observations. "The Warsh Test, Round Two: Hiking Into a Bond Rally" looked at a Fed tightening while long yields fell, which is close to the setup the bill market is describing now.15 "Treasuries Are a Hedge Again. Credit and Oil Explain Why." argued that long Treasuries had regained their role as a hedge, and October's 31 basis point drop in the 10-year yield during the chip selloff was an example of that.16, 8 The bill market is the other half of the picture: long bonds can rally on growth fears while the front end keeps pricing policy.
The Takeaway
The Fed paused on October 28. The bill market did not. With the 3-month bill at 4.18% against a 4.00% ceiling, the market is already living with the next hike.1, 2 In 37 of 45 similar episodes since 1990, the Fed caught up within about three months. The exceptions came at the end of cycles, and that is the debate worth having now: whether this is the end of the cycle or not.
Notes
- [1] Board of Governors of the Federal Reserve System, Market Yield on U.S. Treasury Securities at 3-Month Constant Maturity (DGS3MO), via FRED; 4.18% on Oct 29, 2026. Episode counts are Lead-Lag Report calculations: fred.stlouisfed.org/series/DGS3MO
- [2] Board of Governors of the Federal Reserve System, Federal Funds Target Range, Upper Limit (DFEDTARU), via FRED; 4.00% since Sep 17, 2026: fred.stlouisfed.org/series/DFEDTARU
- [3] Board of Governors of the Federal Reserve System, Federal Funds Target Rate (DFEDTAR, discontinued Dec 2008), via FRED: fred.stlouisfed.org/series/DFEDTAR
- [4] Federal Reserve FOMC statement, October 28, 2026 (target range 3-3/4 to 4 percent; Cook and Hammack preferred a 1/4 point hike): www.federalreserve.gov/newsevents/pressreleases/monetary20261028a.htm
- [5] Reuters via Hurriyet Daily News, "Rising oil prices and inflation weigh on gold," October 30, 2026 (about 75% chance of a December rate increase per CME FedWatch): www.hurriyetdailynews.com/rising-oil-prices-and-inflation-weigh-on-gold-228794
- [6] Reuters, "Gold hits 3-1/2-month low on Fed hike fears, set for monthly loss," October 30, 2026 (U.S. GDP and September inflation): www.reuters.com/world/india/gold-slips-higher-oil-us-inflation-data-bolster-fed-hike-bets-2026-10-30/
- [7] Board of Governors of the Federal Reserve System, Market Yield on U.S. Treasury Securities at 2-Year Constant Maturity (DGS2), via FRED; 3.47% on Jan 2 and 4.61% on Oct 29, 2026: fred.stlouisfed.org/series/DGS2
- [8] Board of Governors of the Federal Reserve System, Market Yield on U.S. Treasury Securities at 10-Year Constant Maturity (DGS10), via FRED; 4.19% on Jan 2, 5.29% on Sep 30 and 4.98% on Oct 29, 2026: fred.stlouisfed.org/series/DGS10
- [9] Board of Governors of the Federal Reserve System, Market Yield on U.S. Treasury Securities at 30-Year Constant Maturity (DGS30), via FRED; 5.32% on Oct 29, 2026: fred.stlouisfed.org/series/DGS30
- [10] Reuters via The Kansas City Star, "Wall Street closes sharply lower as AI cash burn fears spark tech selloff," October 30, 2026: www.kansascity.com/news/business/article317845088.html
- [11] Reuters via The State, "Oil set for fourth monthly gain as Hormuz tanker attack highlights supply risks," October 30, 2026: www.thestate.com/news/nation-world/national/article317843179.html
- [12] Reuters via The Kansas City Star, "ECB governors see December hike likely followed by pause, sources say," October 29, 2026: www.kansascity.com/news/nation-world/national/article317833742.html
- [13] Federal Reserve Bank of St. Louis, 10-Year Treasury Constant Maturity Minus 2-Year Treasury Constant Maturity (T10Y2Y), via FRED; 0.38 on Oct 30, 2026: fred.stlouisfed.org/series/T10Y2Y
- [14] Federal Reserve Bank of St. Louis, 10-Year Treasury Constant Maturity Minus 3-Month Treasury Constant Maturity (T10Y3M), via FRED; 0.78 on Oct 30, 2026: fred.stlouisfed.org/series/T10Y3M
- [15] The Lead-Lag Report, Macro Observations, October 25, 2026: www.leadlagreport.com/the-warsh-test-round-two-hiking-into-a-bond-rally/
- [16] The Lead-Lag Report, Macro Observations, October 25, 2026: www.leadlagreport.com/treasuries-are-a-hedge-again-credit-and-oil-explain-why/