The S&P 500 Fell in October. The Average Stock Rose 5%.
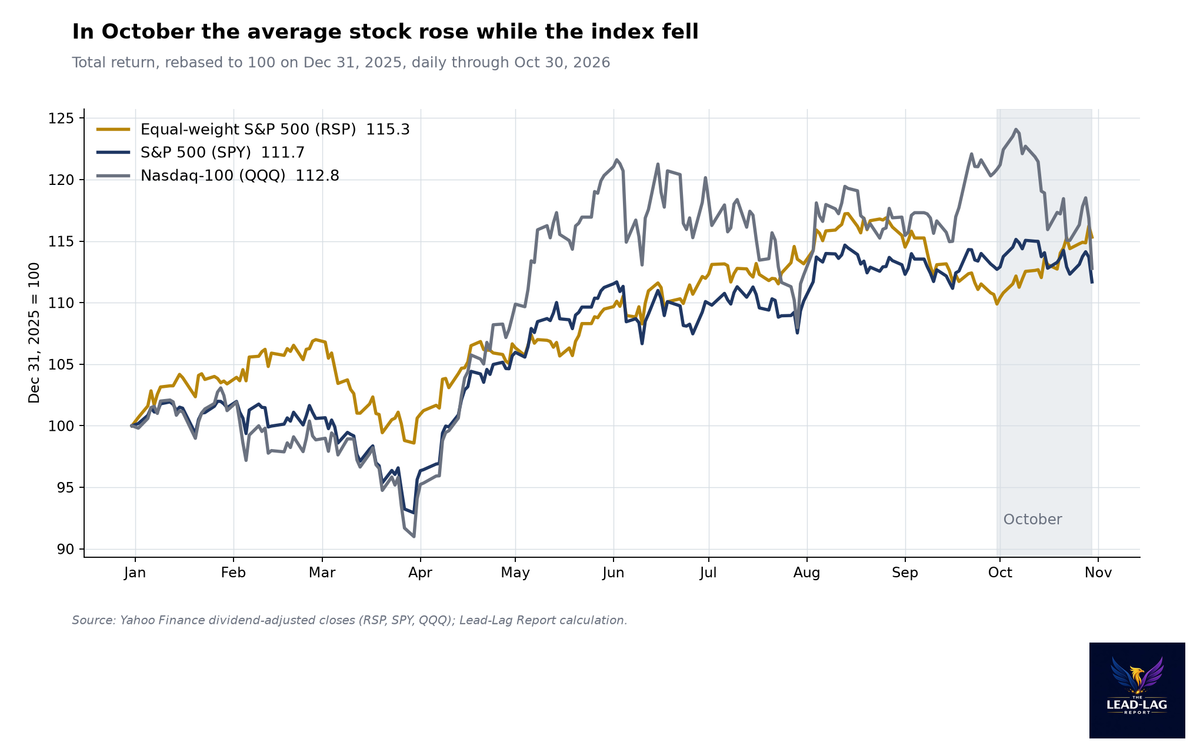
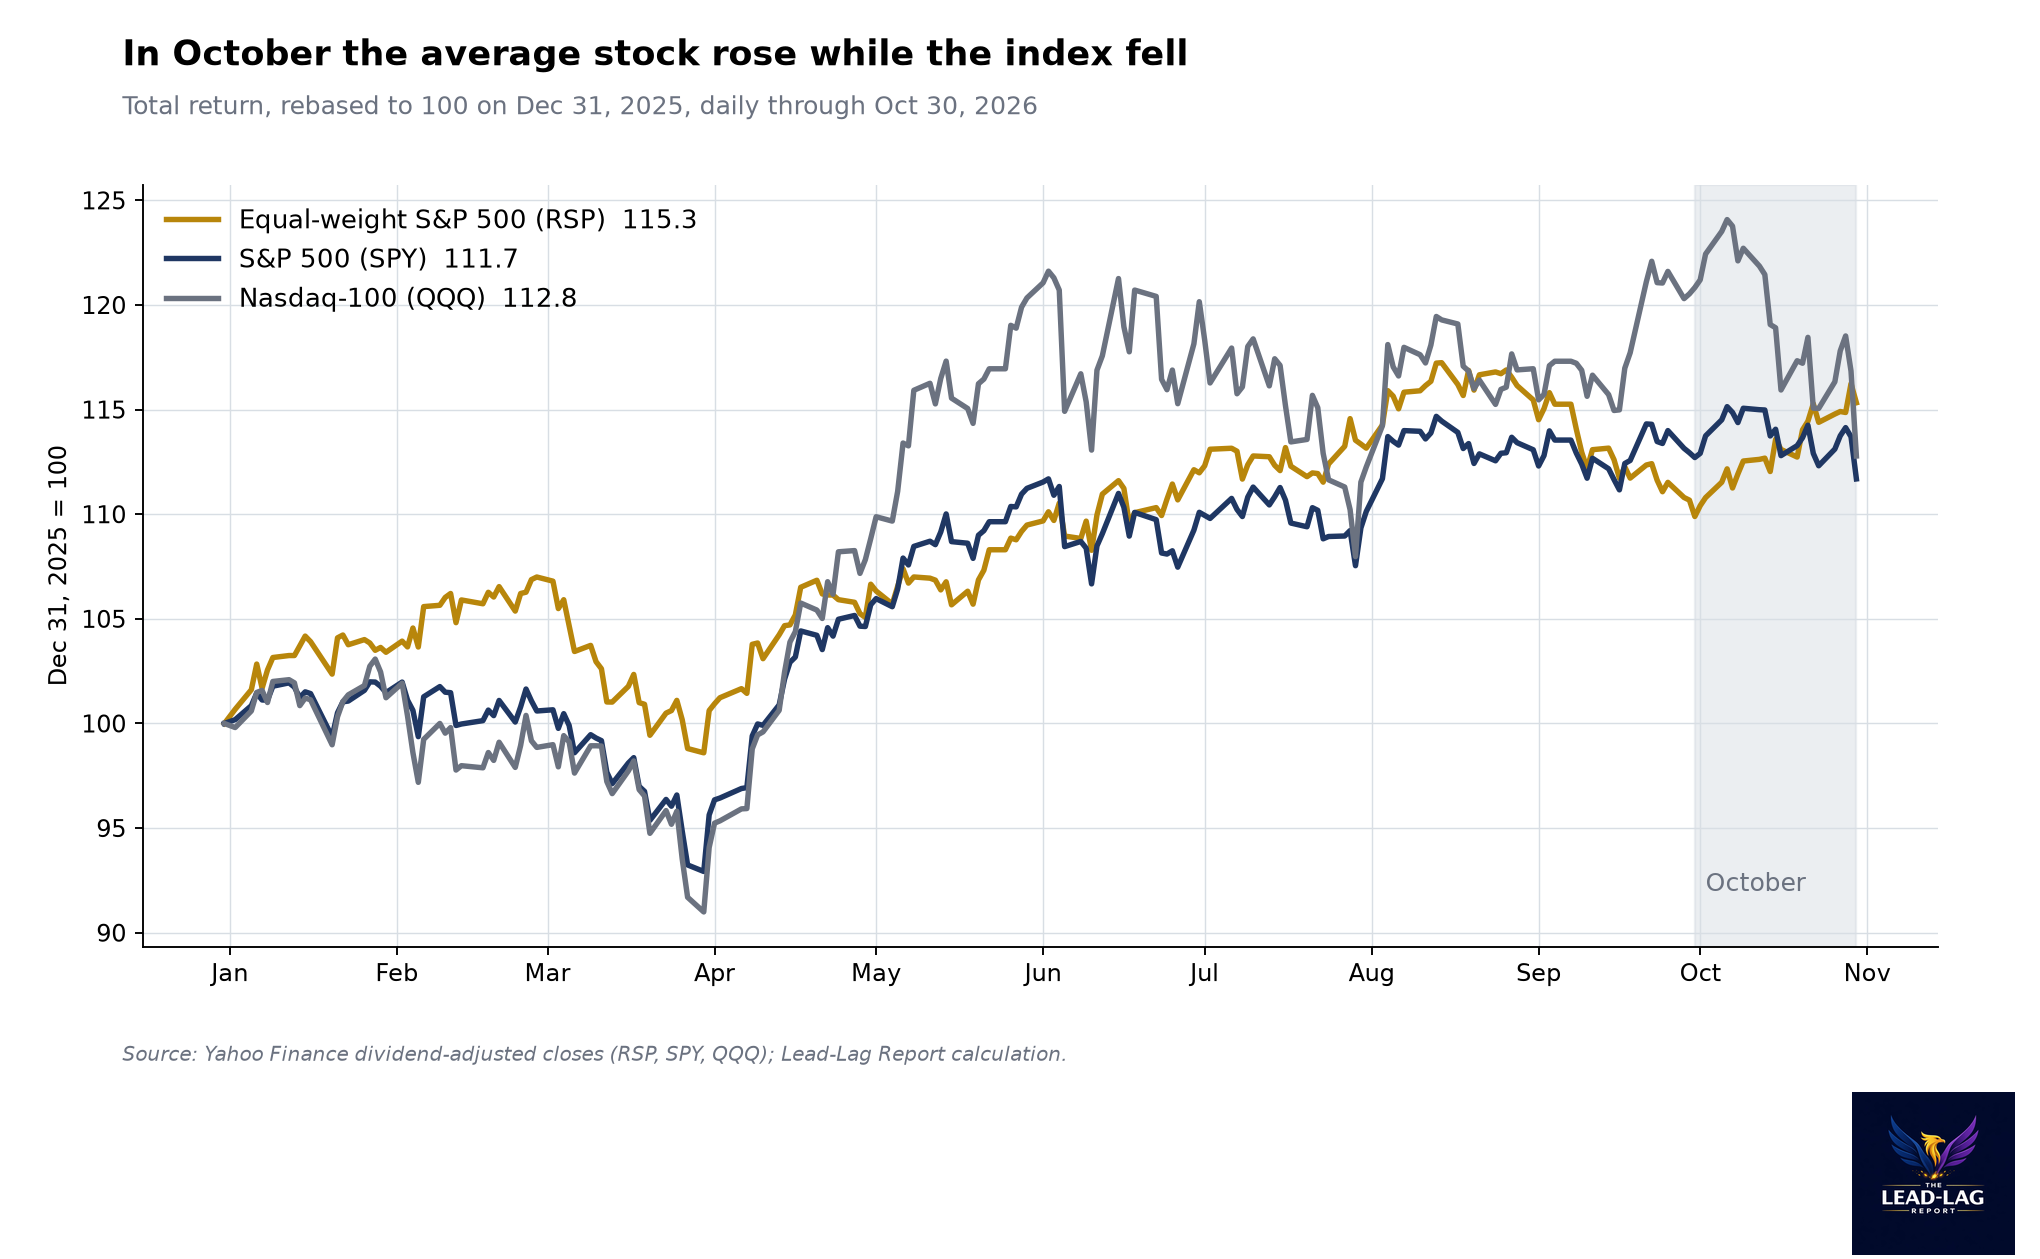
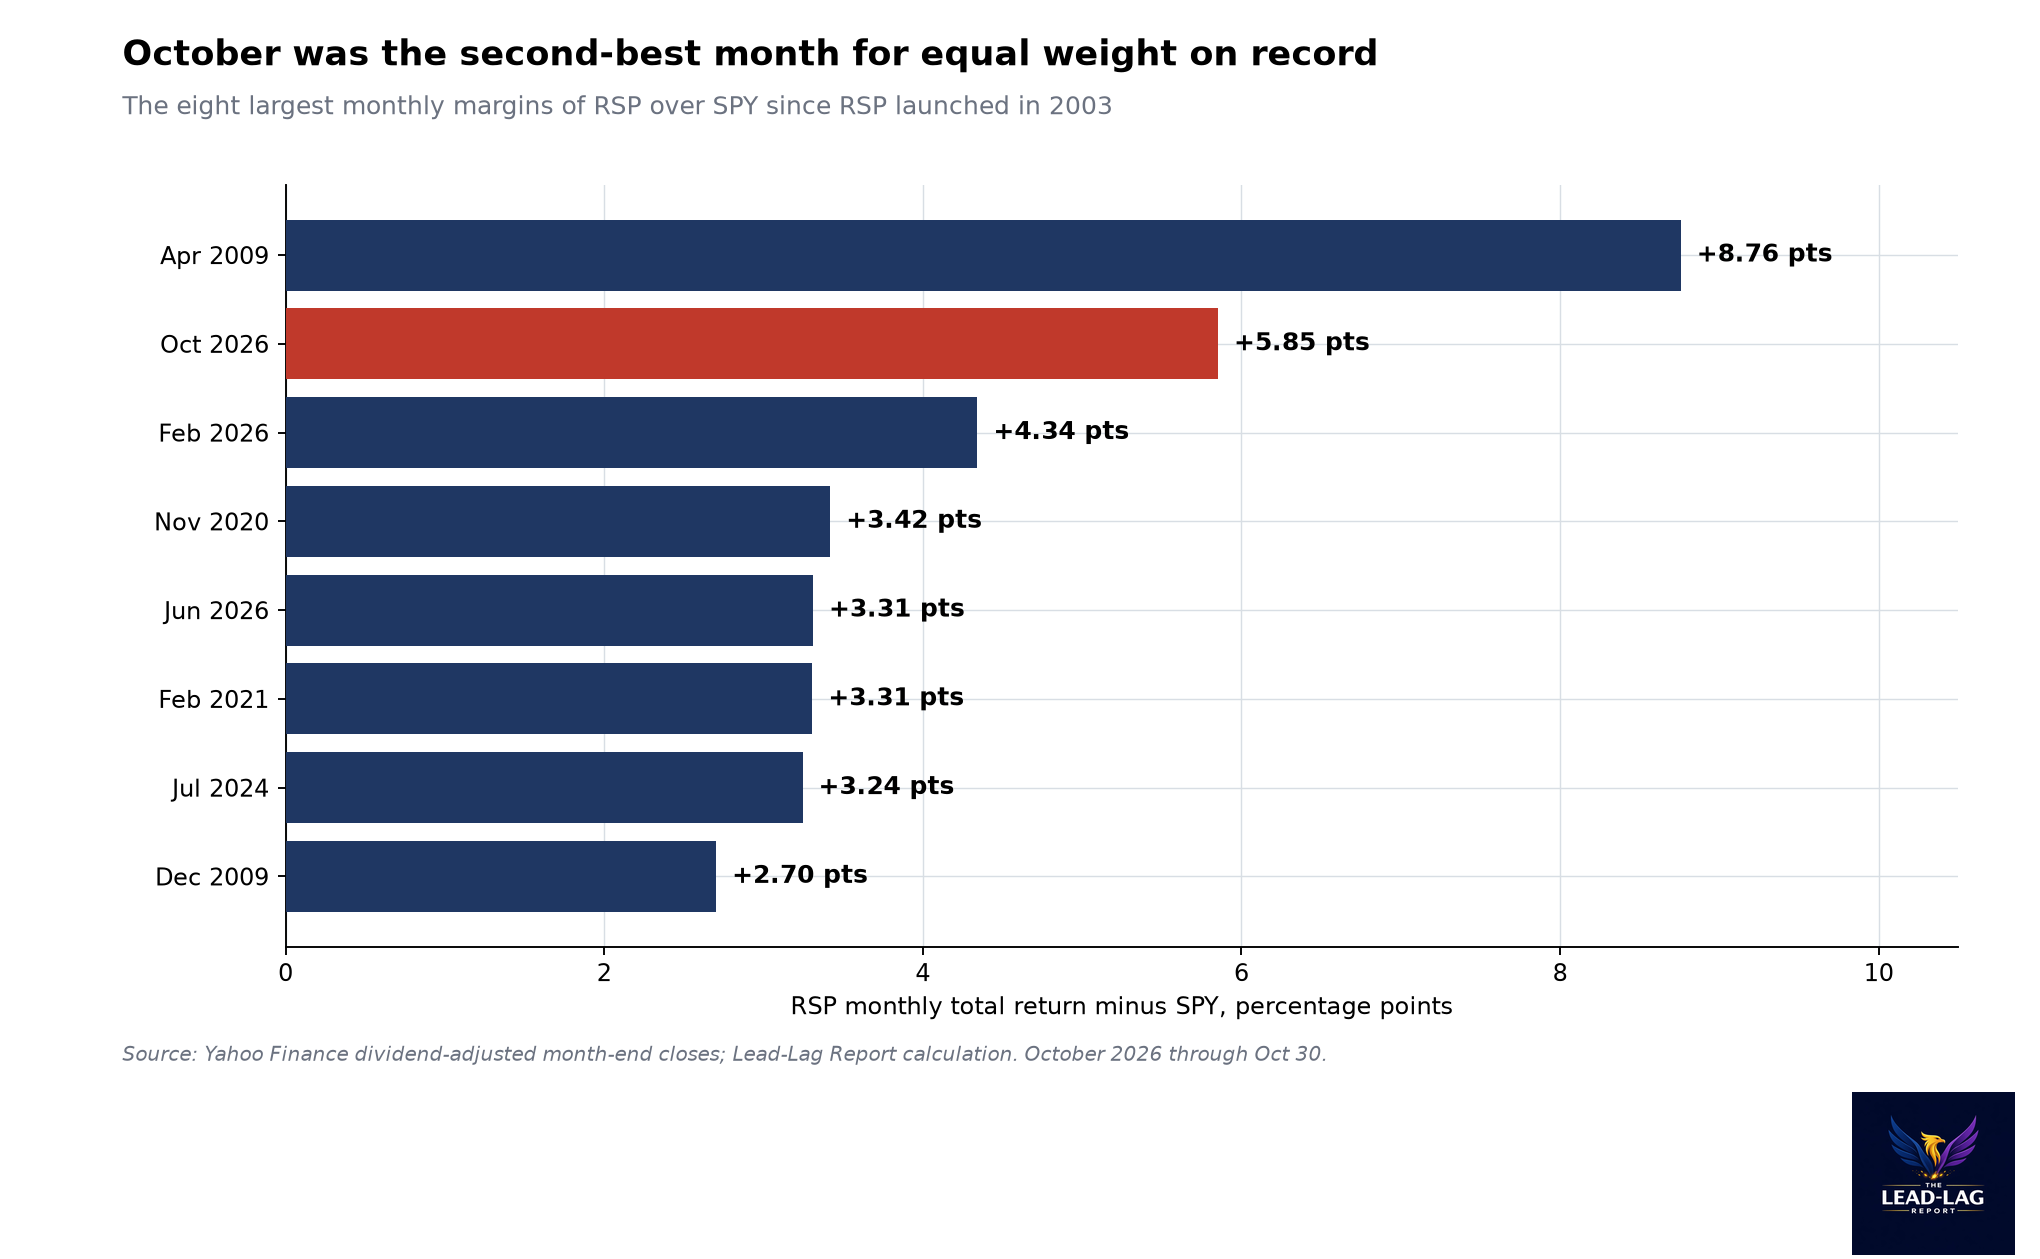
RSP returned 4.95% in October while SPY lost 0.91%, the second-widest monthly margin for equal weight since 2003. The market's leadership got wider.

Today’s Lead-Lag Report post is sponsored by Bridges Capital

The Bridges Capital Tactical ETF (BDGS) is an actively managed fund that seeks to provide capital appreciation while preserving capital during market drawdowns. Rather than holding a static allocation, the fund tactically moves between passively managed U.S. equity index ETFs, large-capitalization U.S. stocks, and cash or cash equivalents — adjusting exposure as macroeconomic conditions, market breadth, and volatility change. The goal is a smoother ride through the full market cycle: participation when conditions are favorable, and a defensive posture when they deteriorate. For advisors looking to add a drawdown-aware equity allocation to client portfolios, BDGS offers a disciplined, rules-based approach managed by Bridges Capital, a Fort Lauderdale-based SEC-registered investment adviser.
Learn more about the Bridges Capital Tactical ETF (BDGS)
The Fund’s investment objectives, risks, charges and expenses must be considered carefully before investing. This and other important information is contained in the Prospectus and SAI, which may be obtained by following the links or by calling 954-271-1075. Please read the prospectus carefully before investing.
Investments involve risk. Principal loss is possible. The Fund is actively managed and may not meet its investment objective based on the Adviser’s or Sub-Adviser’s success or failure to implement investment strategies for the Fund. ETFs may trade at a premium or discount to their net asset value. ETF shares may only be redeemed at NAV by authorized participants in large creation units. There can be no guarantee that an active trading market for shares will exist. The trading of shares may incur brokerage.
The Fund is distributed by PINE Distributors LLC. The Fund’s investment adviser is Empowered Funds, LLC, which is doing business as ETF Architect. Bridges Capital, LLC serves as the Sub-adviser to the Fund. PINE Distributors LLC is not affiliated with ETF Architect or Bridges Capital, LLC.
ETFAC-5988060-10/26
DISCLAIMER – PLEASE READ: This is sponsored advertising content for which Lead-Lag Publishing, LLC has been paid a fee. The information provided in the link is solely the creation of Bridges Capital. Lead-Lag Publishing, LLC does not guarantee the accuracy or completeness of the information provided in the link or make any representation as to its quality. All statements and expressions provided in the link are the sole opinion of Bridges Capital, and Lead-Lag Publishing, LLC expressly disclaims any responsibility for action taken in connection with the information provided in the link.
The S&P 500 lost about 1% in October and the Nasdaq-100 lost almost 7%. The equal-weight S&P 500 gained about 5%. That gap was the second-widest monthly margin for the average stock on record, and it says more about the health of this market than the headline index does.
MICHAEL A. GAYED, CFA
Key Highlights
- In October the Invesco S&P 500 Equal Weight ETF (RSP) returned 4.95% and the SPDR S&P 500 ETF (SPY) returned negative 0.91%, a 5.85 percentage point gap, by my calculation from dividend-adjusted closes.1
- That is the second-largest monthly margin for RSP over SPY since 2003, behind only April 2009.1
- The RSP-to-SPY ratio hit a record low on October 7 and then rose 6.61% in 17 trading days, a move larger than 99.6% of all 17-day changes in the series.1
- Eight of the 11 S&P 500 sector ETFs ended October above their 200-day moving averages, up from four on October 6, when the index set its record close.1, 2
The Index Fell. The Market Did Not.
October looked like a bad month if you watched the headline. The S&P 500 set a record close of 7,818.93 on October 6 and finished the month at 7,580.07 after a 1.82% drop on October 30.2, 3 The Nasdaq Composite fell 2.86% that day, its largest one-day percentage drop since June 5, as disappointing results from Intel and Amazon added to worries about AI spending.3 The Nasdaq-100 ETF (QQQ) ended the month 6.66% lower and 9.11% below its October 6 high.1
The average stock had a very different month. RSP, which holds every S&P 500 company at roughly the same weight, returned 4.95% in October. SPY, which weights companies by market value, returned negative 0.91%.1 The 5.85 percentage point gap is the second-largest monthly margin in favor of the equal-weight fund since its history begins in 2003. The only bigger month was April 2009, at the start of the recovery from the financial crisis.1
My read is that October was not the start of a bear market. It was an unwind of concentration. Money left the handful of companies that had carried the index and moved into the rest of it. For tactical investors, that difference matters more than any single month's return, because a concentration unwind and a broad market decline call for very different risk responses.
A Record Low, Then A Sharp Reversal
To see how unusual this is, look at the ratio of RSP to SPY on a total return basis. When it falls, the largest companies are outperforming the average company. When it rises, the average company is catching up. That ratio hit its lowest level in its history on October 7, the day after the index record.1 It then rose 6.61% in 17 trading days through October 30.1
That is a larger 17-day move than 99.6% of all readings since 2003.1 When I group the biggest moves into separate episodes at least 60 days apart, only three were larger: June 2020, at 9.85%; April 2009, at 7.47%; and July 2024, at 6.78%.1 October 2026 is the fourth-largest equal-weight surge in the fund's history.
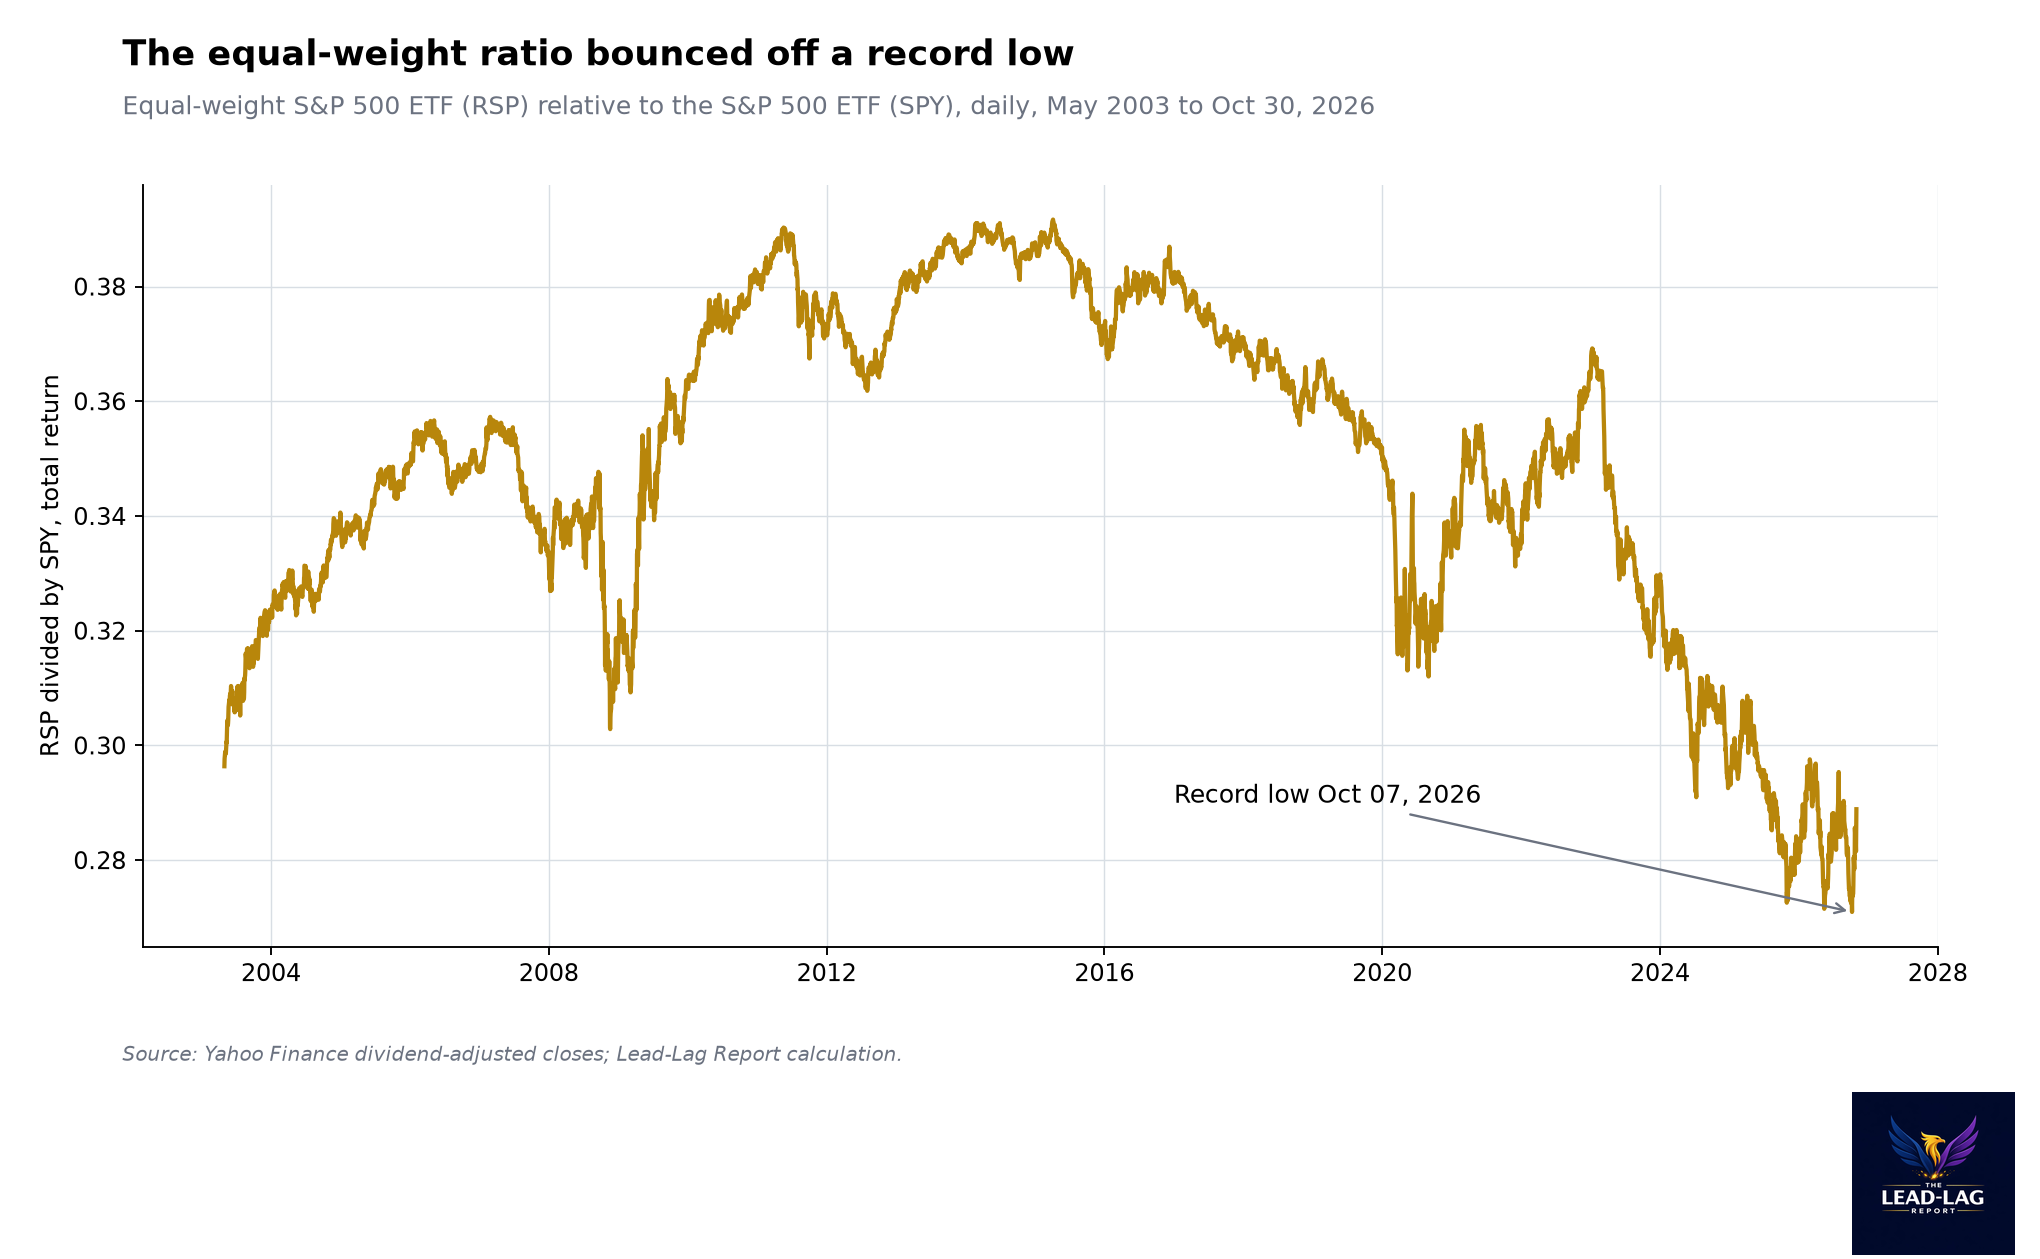
It is worth being clear about how far the ratio had fallen before this bounce. At the start of 2023 it stood near 0.365. On October 7 it was 0.271.1 Over that stretch the average S&P 500 stock lagged the cap-weighted index by roughly a quarter. One month of catch-up does not reverse that, but it is the first time in a long while that the gap has closed this quickly.
What Happened After Similar Surges
Base rates help here. I looked at what happened over the following 63 trading days, about three months, after each of the seven completed episodes in the top eight list: June 2020, April 2009, July 2024, November 2020, March 2021, June 2026 and January 2009.1
SPY was higher three months later in six of the seven. The gains ranged from 4.8% after June 2026 to 13.8% after April 2009. The one decline was January 2009, when SPY fell 5.1% over the next three months as the financial crisis reached its low.1 So a sharp broadening has usually been followed by a higher market, not a lower one.
On average, SPY returned 6.6% over the three months after these seven episodes, and RSP returned 5.4%.1 Over six months, which I can measure for six of the seven, SPY was higher in five, with an average gain of 15.1%. The exception was again January 2009.1 The longer the window, the more the result reflects the broader market cycle rather than the rotation itself, so I put more weight on the three-month numbers. Even so, none of these episodes marked the start of a lasting bear market in the months that followed, apart from the early 2009 case that came at the very end of one.
Whether equal weight kept its lead is a different matter. RSP beat SPY over the following three months in only three of the seven cases: April 2009, November 2020 and January 2009.1 In June 2020 and June 2026, the large companies took the lead back within weeks. The pattern is that broadening tends to be good for the market as a whole, but it does not reliably produce a lasting rotation.
Where The Money Went
The sector numbers show what drove the shift. In October the Energy Select Sector SPDR (XLE) returned 13.85% and the Utilities Select Sector SPDR (XLU) returned 10.12%, while the Technology Select Sector SPDR (XLK) lost 8.30% and the Communication Services Select Sector SPDR (XLC) lost 9.98%.1 On October 30 alone, energy rose 1.9% and consumer staples rose 1.4% even as the index fell, according to The New York Times.4
The chip sector carried most of the damage. The iShares Semiconductor ETF (SOXX) fell 17.08% in October and ended the month 27.97% below its June 22 high, though it is still up 56.84% for the year.1 The broader chip index lost 7.2% on October 30.3 When the leading group of a bull market falls that hard and the index loses only about 1%, the rest of the market is doing a lot of work.
The improvement shows up in trend measures too. On October 6, the day of the S&P 500 record, only four of the 11 sector SPDR funds were above their 200-day moving averages. By October 30, eight were, by my calculation.1 The index made its high on narrow leadership and then fell while participation widened.
Nine Of Eleven Sectors Beat The Index
Another way to measure breadth is to count how many sectors beat the index. In October, nine of the 11 sector SPDR funds outperformed SPY, and the same nine posted positive returns. Consumer staples (XLP) returned 10.94%, health care (XLV) 9.77% and materials (XLB) 8.30%. Only technology and communication services lost money.1
That is rare. Since the full set of 11 sector funds began trading together in mid-2018, there have been 100 complete months in my data. Nine or more sectors beat SPY in only three of them: July 2024, March 2025 and October 2026.1 Months like that happen when the largest companies in the index fall while almost everything else rises. That is the signature of a concentration unwind, not of a broad decline.
The point for a portfolio is simple. Most investors own the S&P 500 through cap-weighted funds, where the largest technology and communication companies carry the most weight. In October, that weighting hid the fact that most of the market was rising. A portfolio that owned the same stocks in equal amounts had one of its best relative months on record.1
The mix of winners matters too. The three classic defensive sectors, consumer staples, utilities and health care, returned 10.94%, 10.12% and 9.77%. But cyclical groups rose as well: financials (XLF) returned 5.82%, consumer discretionary (XLY) 6.01% and materials 8.30%.1 If October had been a pure flight to safety, I would expect the cyclical sectors to have fallen alongside technology. They did not.
How The Index Got So Concentrated
This did not happen overnight. On a total return basis, RSP trailed SPY by 9.89% in 2023, 9.69% in 2024 and 5.53% in 2025, measured by the change in the ratio between them.1 In 2026, through October 7, it fell another 3.14%.1 By then the ratio was lower than at any point since RSP's history in my data begins in 2003.1
The October bounce has already lifted the ratio 3.26% for the year.1 That means equal weight is now ahead of cap weight in 2026, after three straight years of underperformance. If that holds through December, it would be the first calendar year since 2022 in which the average S&P 500 stock beat the index.1
Small And Mid Caps Are Not Confirming Yet
That said, the broadening is not complete. The iShares Russell 2000 ETF (IWM) rose 0.52% in October and the SPDR S&P MidCap 400 ETF (MDY) rose 1.85%.1 Both remain below their August 14 highs, by 8.20% and 6.48%.1 RSP itself is 1.63% below its own August 14 high.1 Large-cap equal weight is leading the catch-up. Smaller companies are lagging.
That makes sense with a 10-year Treasury yield near 5% and a bill market pricing another Fed hike. The 10-year yielded 4.98% on October 29.5 Rate-sensitive small caps are unlikely to lead while borrowing costs are this high, even if investors are rotating away from the most expensive large companies.
Volatility Is Not Signaling Panic
The Cboe Volatility Index (VIX) closed at 19.42 on October 30, up from 16.34 at the end of September.1 Its 2026 high was 31.05 on March 27.1 A VIX below 20 on the day the Nasdaq had its worst session since June is consistent with a rotation rather than a liquidation. In a broad risk-off move, I would expect the VIX to rise much faster than this, as investors pay up for protection across the market and not just in technology.
For a tactical allocator, I think the relevant question is not whether stocks are falling. It is which stocks are falling and whether the selling is spreading. In October the selling was concentrated and the buying was broad. That is a regime where cutting overall equity exposure may be less effective than reducing concentration.
The Case Against Me
The strongest objection is that broadening during a selloff can be the early stage of a wider decline. In January 2009, equal weight surged and SPY was still 5.1% lower three months later.1 If the AI spending worries that hit Intel and Amazon spread into a broader earnings slowdown, the average stock will not be spared for long.3
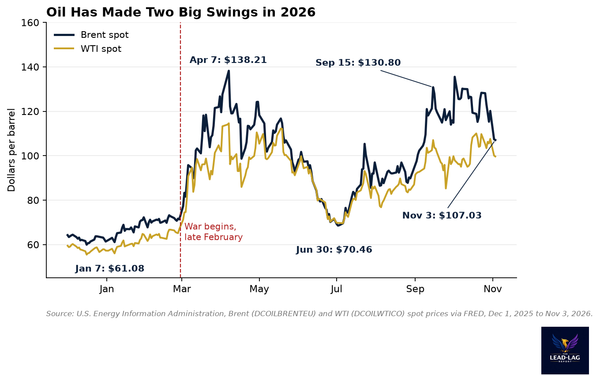
The second objection is about what is driving the rotation. Energy and utilities led October, and energy rose with Brent crude at $117.64 at the end of the month.4, 6 A rally driven by an oil shock and defensive sectors is not the same as a healthy economic broadening. If oil falls, part of the equal-weight gain could reverse quickly.
The third is the base rate itself. Only seven completed episodes is a small sample, and they come from very different market regimes.1 I treat the six-of-seven figure as a tilt in the odds, not as a forecast.
What Would Change My View
First, if the RSP-to-SPY ratio falls back below its October 7 record low before December 31, the broadening has failed and the market is back to depending on a few large companies.1
Second, if the S&P 500 closes more than 10% below its October 6 record, which means below roughly 7,037, the selling has spread beyond concentration and I would treat it as a broader correction.2
Third, if the VIX closes above 30, near its March high, the market would be paying for protection across the board, which is inconsistent with a simple rotation.1
How This Fits What I Have Written
Two recent Macro Observations set up this one. "Small Caps Are Paying The 10-Year's Bill" covered how higher long yields were weighing on smaller companies, which is still visible in IWM's lag behind equal weight.7 "The Index Stopped Buying Itself. Now It Borrows to Build." looked at how the largest companies were financing their spending, the same AI spending that markets questioned in October.8, 3 October's rotation is one way investors responded to that question: by owning less of the biggest spenders and more of everything else.
The Takeaway
October's index return hid one of the strongest months for the average stock on record. The equal-weight S&P 500 gained 4.95% while the cap-weighted index lost 0.91%, and the ratio between them came off a record low faster than in all but three past episodes.1 After similar surges, the market was usually higher three months later, even if equal weight did not always keep its lead. The market did not get weaker in October. Its leadership got wider.
Notes
- [1] Yahoo Finance dividend-adjusted daily closes for RSP, SPY, QQQ, IWM, MDY, SOXX, the 11 Select Sector SPDR funds and the Cboe Volatility Index (^VIX), May 2003 to October 30, 2026. Returns, ratios, moving averages, rankings and episode results are Lead-Lag Report calculations: finance.yahoo.com/quote/RSP/history/
- [2] Yahoo Finance, S&P 500 Index (^GSPC) daily closes; record close of 7,818.93 on Oct 6, 2026: finance.yahoo.com/quote/%5EGSPC/history/
- [3] Reuters via The Kansas City Star, "Wall Street closes sharply lower as AI cash burn fears spark tech selloff," October 30, 2026 (S&P 500 down 1.82% to 7,580.07; Nasdaq down 2.86%; chip index down 7.2%): www.kansascity.com/news/business/article317845088.html
- [4] The New York Times, stock market coverage, October 30, 2026 (energy up 1.9%, consumer staples up 1.4%): www.nytimes.com/2026/10/30/business/stock-market-october-ai.html
- [5] Board of Governors of the Federal Reserve System, Market Yield on U.S. Treasury Securities at 10-Year Constant Maturity (DGS10), via FRED; 4.98% on Oct 29, 2026: fred.stlouisfed.org/series/DGS10
- [6] Reuters via The State, "Oil set for fourth monthly gain as Hormuz tanker attack highlights supply risks," October 30, 2026 (Brent December settled at $117.64): www.thestate.com/news/nation-world/national/article317843179.html
- [7] The Lead-Lag Report, Macro Observations, October 17, 2026: www.leadlagreport.com/small-caps-are-paying-the-10-years-bill/
- [8] The Lead-Lag Report, Macro Observations, October 28, 2026: www.leadlagreport.com/the-index-stopped-buying-itself-now-it-borrows-to-build/