Chip Stocks Fell 7.2% in a Day. The Low Usually Comes Later.
The chip index fell 7.2% on October 30, its third 7% drop of 2026. In 44 of 48 past cases since 1994, it traded lower within three months, even when it later recovered.



Special Announcement
Houston, we have liftoff.
The Tuttle Capital Space Industry Income Blast ETF (SPCI) is designed to give investors exposure to the performance of companies in the Syntax Space Industry Index — commercial space, satellites, launch, and related infrastructure — combined with a systematic weekly income overlay.
The Syntax Space Industry Index measures the performance of companies with significant exposure to space-related activities, including GPS and geospatial technologies, satellite operations and manufacturing, space programs, launch services, and spacecraft.
The fund aims to capture up to approximately 100% of the index’s upside before fees, while generating income through a systematic put spread strategy and other structured options positions. Distributions may include return of capital.
A put credit spread is an options strategy in which the Fund sells a put option to collect premium income and simultaneously buys a lower-strike put option to help limit downside risk, resulting in a net credit to the Fund.
Launched March 12, 2026 on Cboe.
Learn more at https://www.incomeblastetfs.com/etf/spci
Important Disclosures
Investors should carefully consider the investment objectives, risks, charges, and expenses of the Tuttle Capital Space Industry Income Blast ETF (SPCI) before investing. For a prospectus with this and other information about the Fund, please visit https://www.incomeblastetfs.com/etf/spci or call (833) 759-6110. Please read the prospectus carefully before investing.
Principal Risks include: Equity Securities Risk, Derivatives Risk, Options Risk, Put Spread Strategy Risk, Counterparty Risk, Liquidity Risk, FLEX Options Risk, Transaction Cost Risk, Active Management Risk, Market Risk, Concentration Risk, Aerospace and Defense Industry Risk, Aviation Sector Risk, Semiconductor Company Risk, Sector Risk, Technology Sector Risk, Inflation Risk, Interest Rate Risk, ETF Structure Risk, and Cyber Security Risk. There is no guarantee that the Fund's investment strategy will be properly implemented, and an investor may lose some or all of its investment.
The Fund's put spread strategy involves substantial risks, including the potential for losses if the underlying security declines below the lower strike price, market volatility impacting option premiums, and the possibility of assignment on the sold puts, which could require the Fund to purchase underlying securities at unfavorable prices. Income generated by the options overlay strategy is not guaranteed.
Index attribution
Neither Tuttle Capital Management nor its affiliates has any ability to select Underlying Index components or change the Underlying Index methodology.
Distributor: Foreside Fund Services, LLC
DISCLAIMER – PLEASE READ: This is sponsored advertising content for which Lead-Lag Publishing, LLC has been paid a fee. The information provided in the link is solely the creation of Tuttle Capital Management. Lead-Lag Publishing, LLC does not guarantee the accuracy or completeness of the information provided in the link or make any representation as to its quality. All statements and expressions provided in the link are the sole opinion of Tuttle Capital Management and Lead-Lag Publishing, LLC expressly disclaims any responsibility for action taken in connection with the information provided in the link.
The Philadelphia Semiconductor Index fell 7.2% on October 30, its third drop of 7% or more this year. It is now 27% below its June record and still up 51% for 2026. I went back to 1994 to see what usually comes after a day like this. The bounce is common. The low usually comes later.
MICHAEL A. GAYED, CFA
Key Highlights
- The Philadelphia Semiconductor Index closed at 10,688.80 on October 30, down 7.2% on the day, 15.4% for October and 27.0% below its June 22 record close.1, 2
- Since 1994 the index has had 49 daily drops of 7% or more. In 44 of the 48 with three months of history after them, it traded below the drop-day close at some point in the next three months, with a median further decline of 13.3%, by my calculation.1
- The same 48 drops were followed by a higher index three months later 67% of the time, with a median gain of 7.0%. Bounces and lower lows have tended to arrive together.1
- 2026 is the seventh year since 1994 with at least three 7% down days. In each of the other six, the index fell at least 35% below its prior record at its low.1
A 7% Day Is Not A Normal Day
Chip stocks had their worst session since June on Friday. The Philadelphia Semiconductor Index fell 7.2% to 10,688.80, and 29 of its 30 members closed lower.1, 2, 4 Intel lost 28.58% after warning about weak PC demand and heavy spending, its steepest one-day decline since July 1974.3, 4 Amazon's results added to the pressure. Its trailing 12-month free cash flow showed a deficit of $42.4 billion, compared with a $7.6 billion shortfall in the second quarter, after a $94.8 billion jump in spending on property and equipment for data centers and AI hardware.4
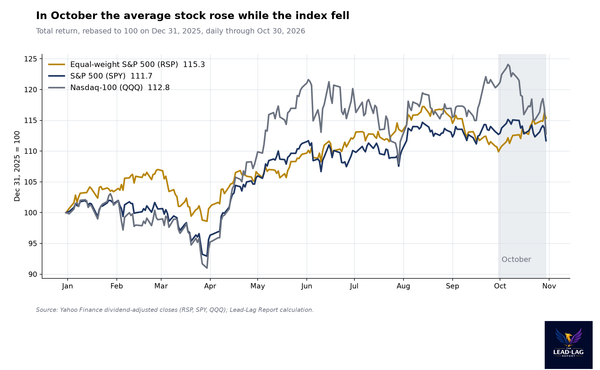
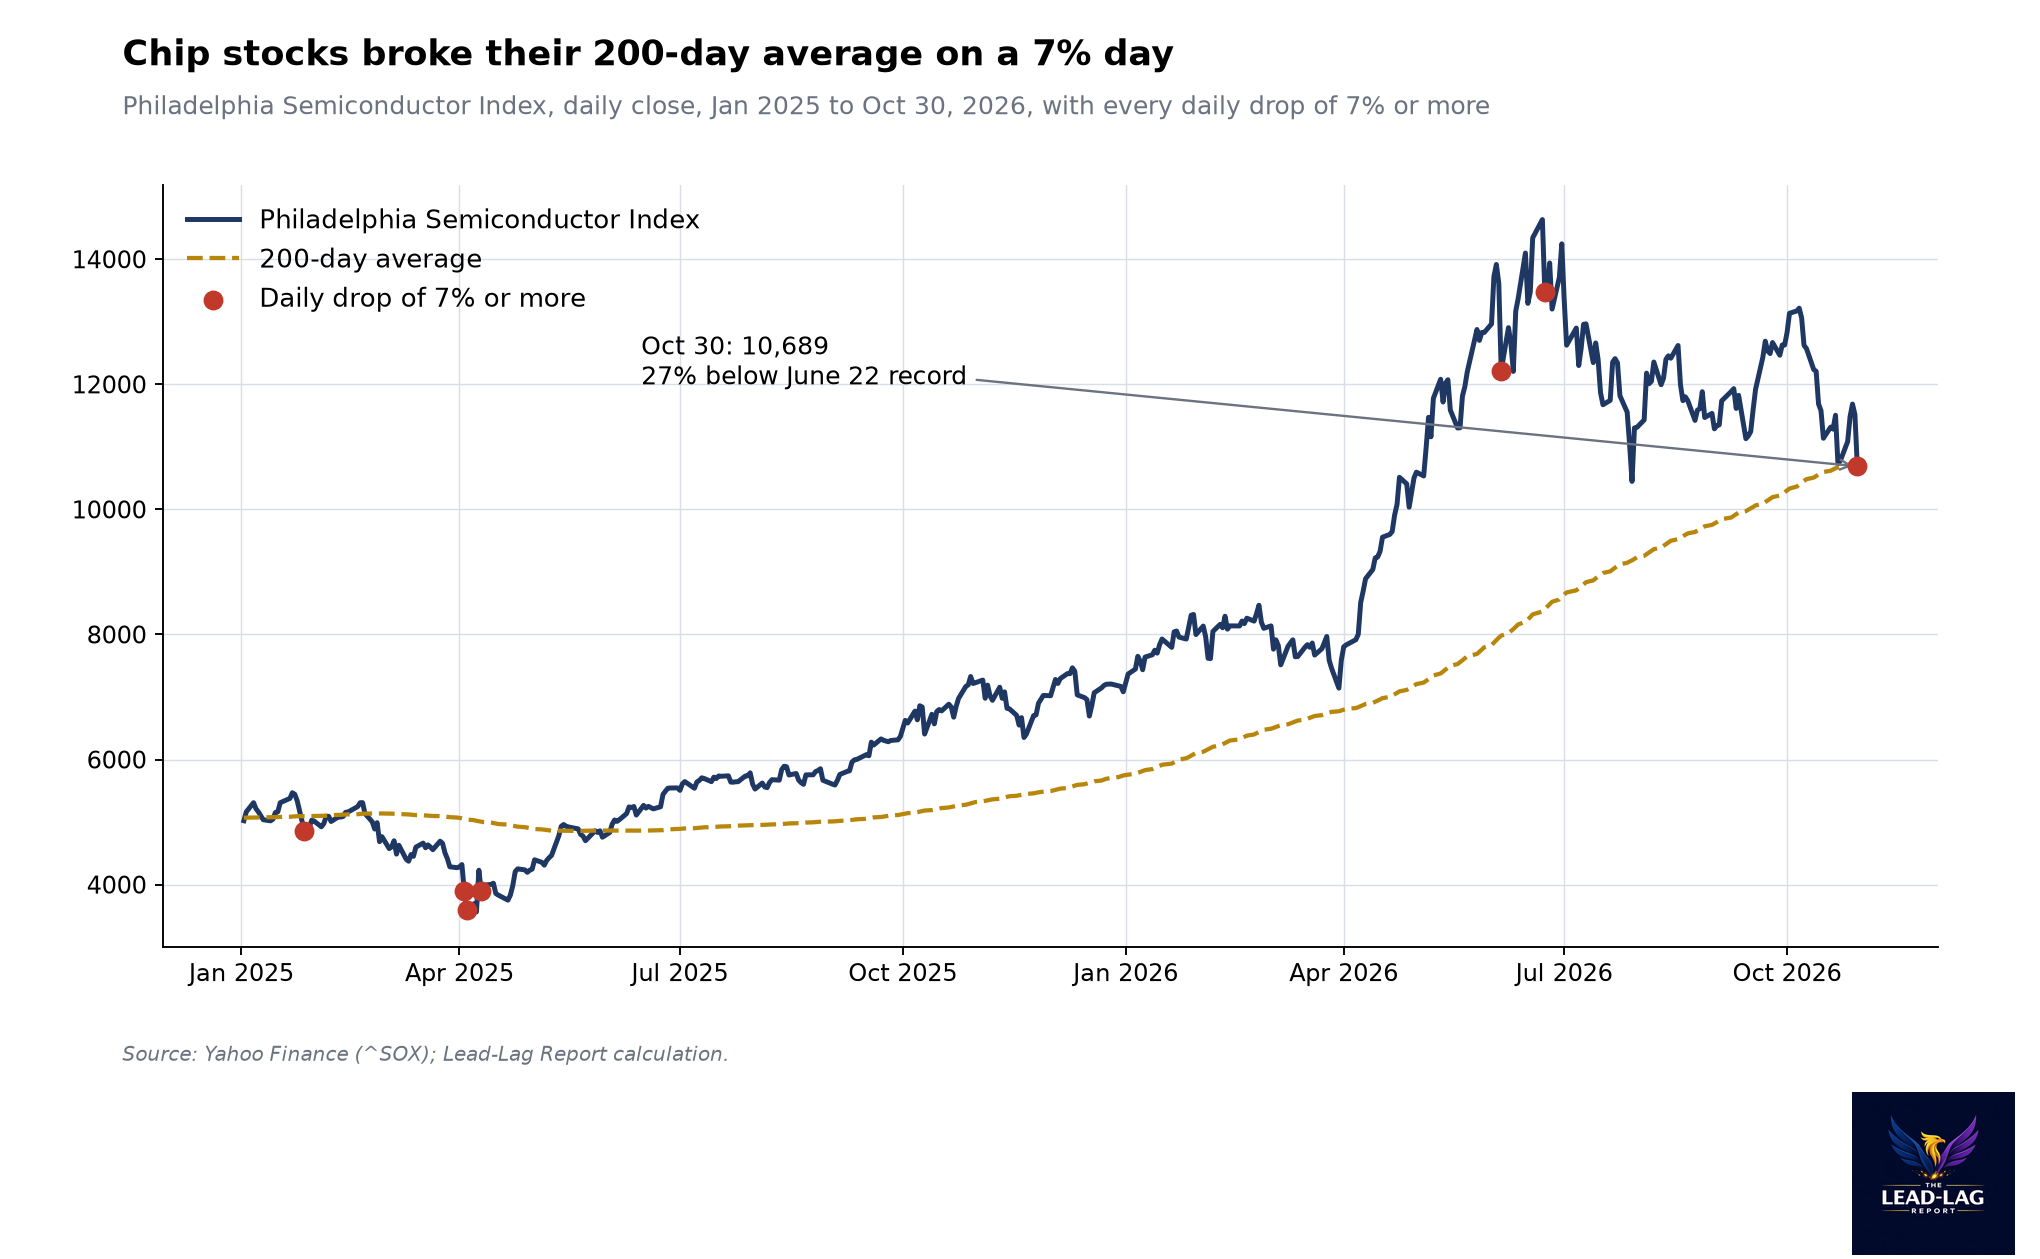
Reuters reported that the chip index finished October with a loss of more than 15%.2 By my count it was 15.4%, against a 5.3% loss for the Nasdaq Composite and a 0.9% loss for the S&P 500.1, 7 The index is now 27.0% below its June 22 record close of 14,634.72. Even so, it is still up 50.9% for the year.1
That combination is what makes this moment hard to read. A bear market by the usual 20% definition sits inside one of the best years on record for the group. My view is that the next three months are more likely to bring another leg lower than a clean recovery from here, even though history says the index is more likely than not to be higher by the end of January. Those two statements are not in conflict, and the data below shows why.
What History Says About Days Like This
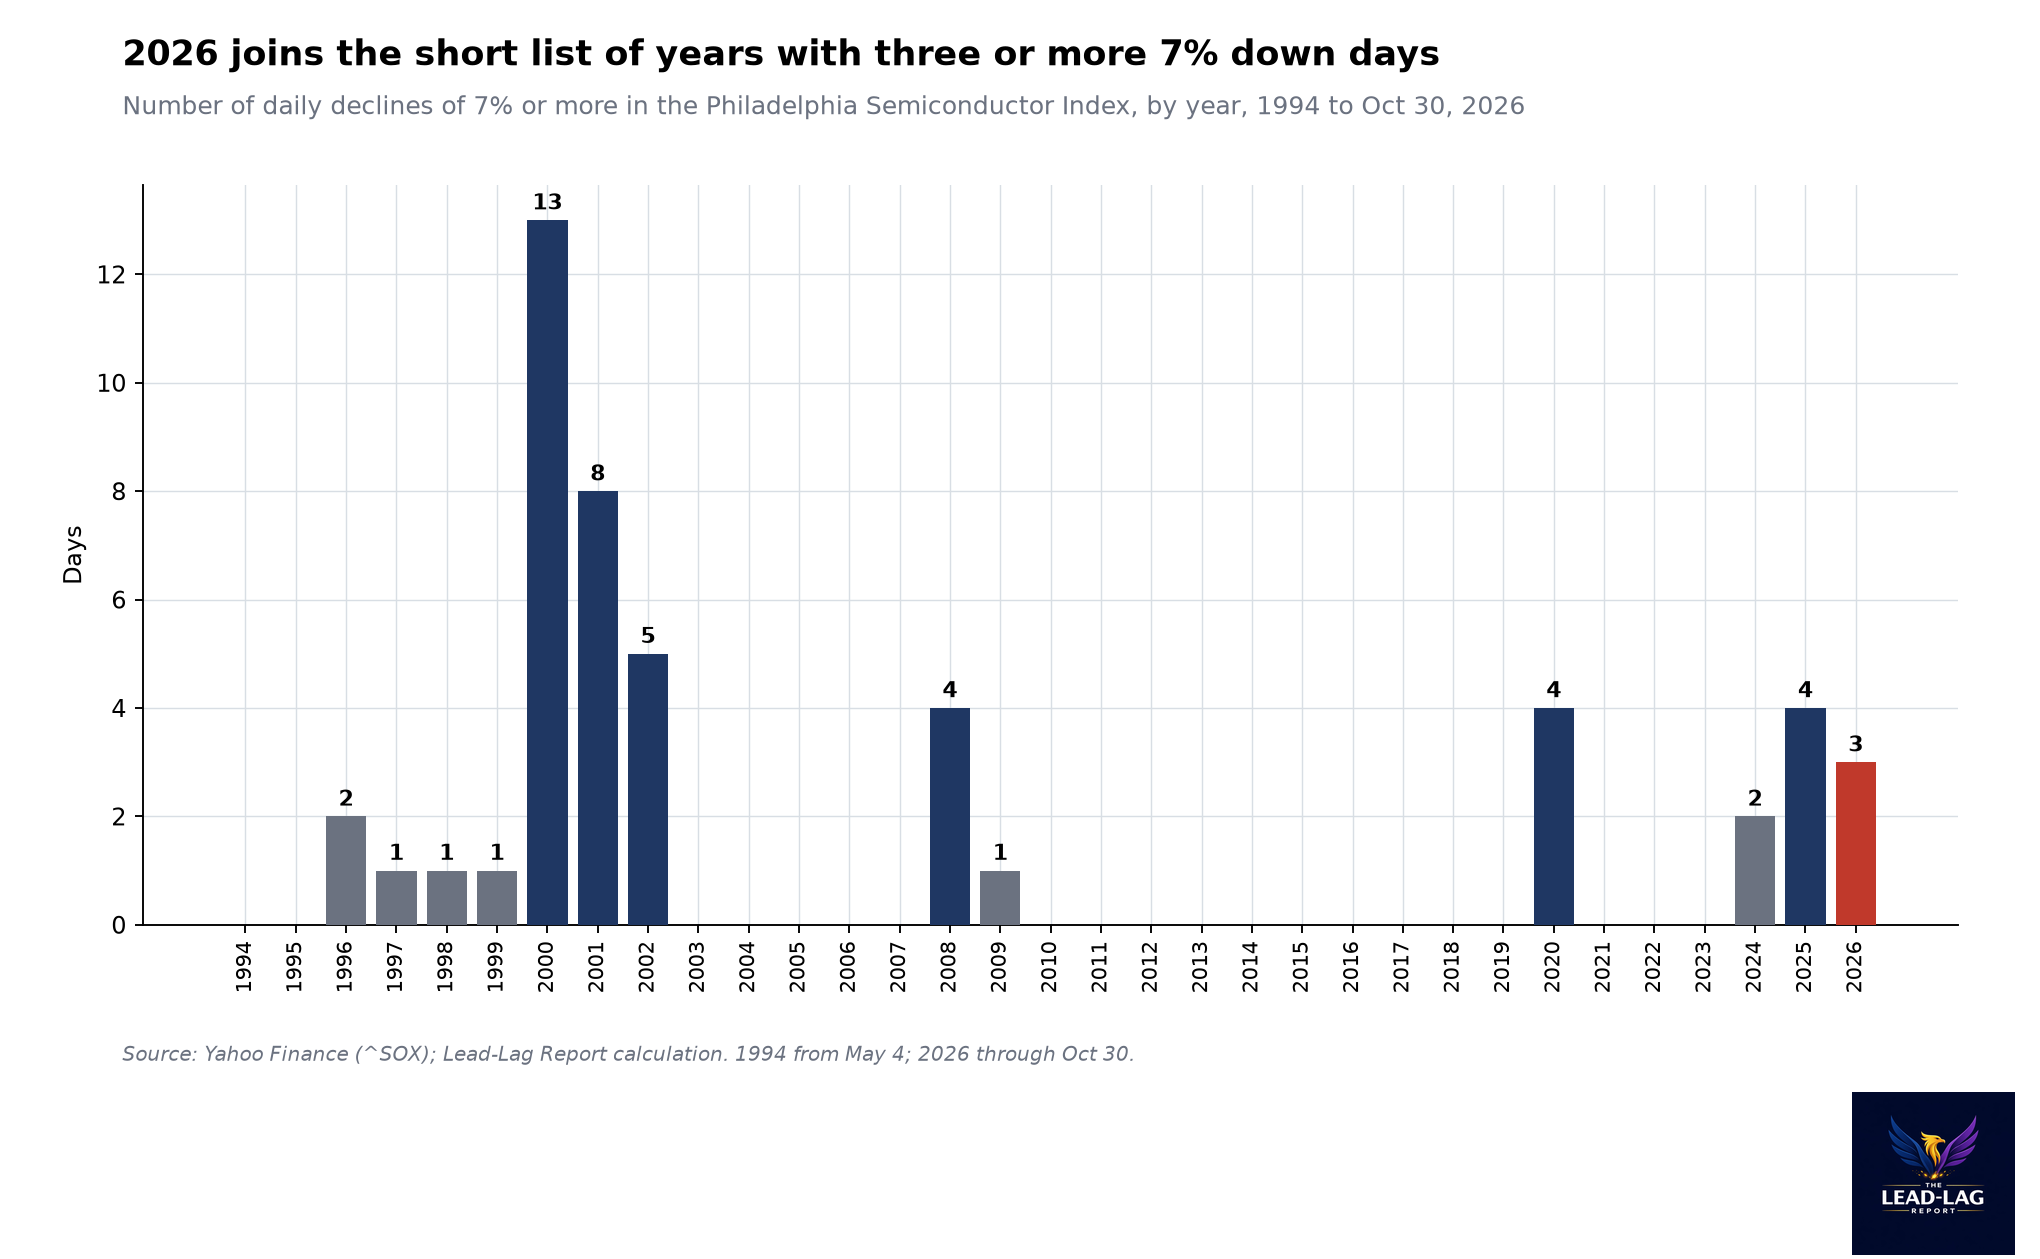
I measured every daily decline of 7% or more in the Philadelphia Semiconductor Index since May 1994, using closing prices. There are 49 of them, including Friday.1 They are not spread evenly. Thirteen came in 2000 alone, eight in 2001 and five in 2002. There were four in 2008, four in 2020 and four in 2025. The rest are scattered across single years.1
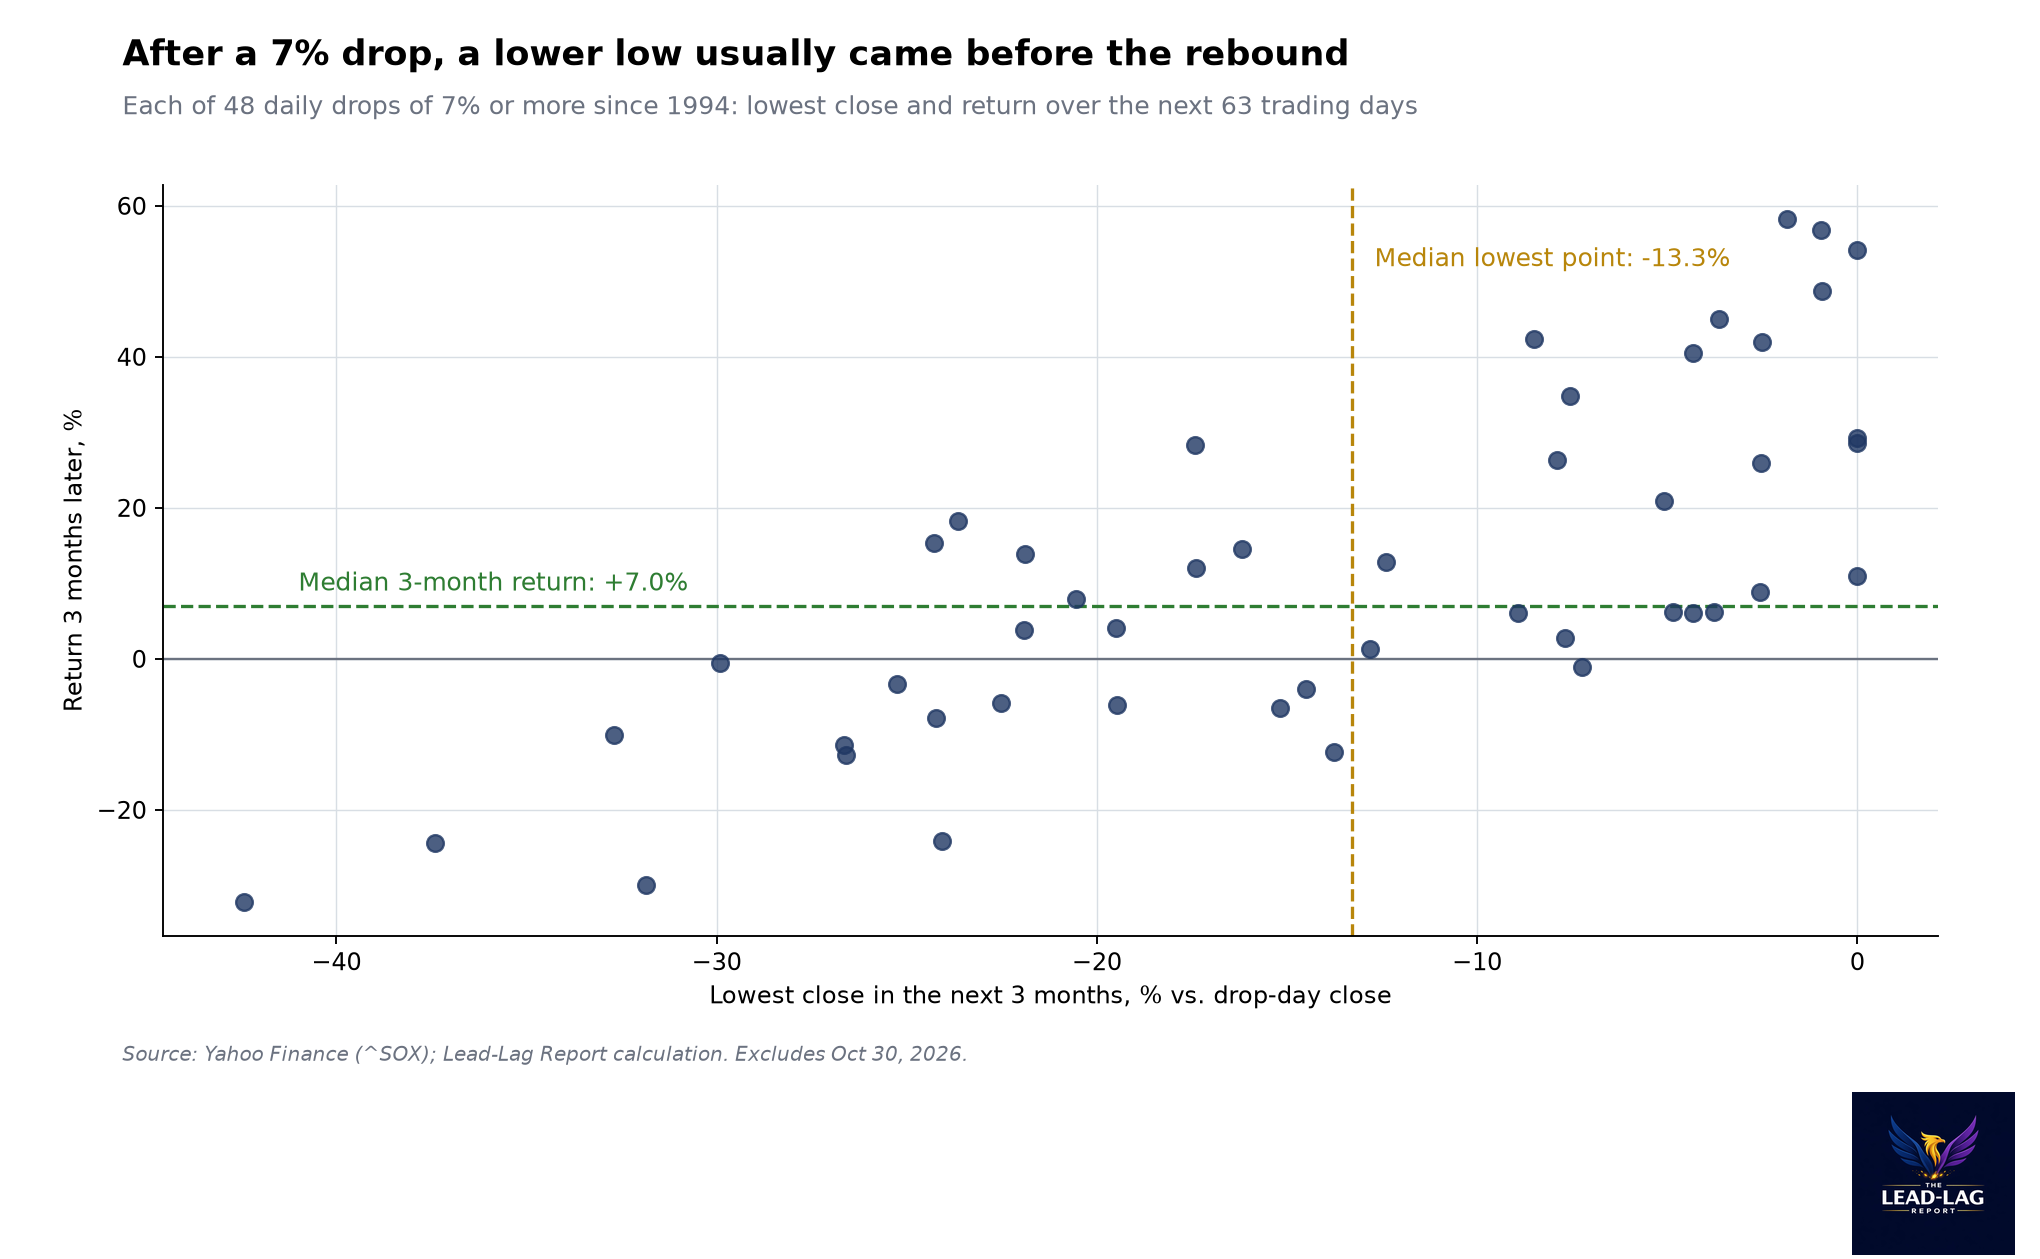
For the 48 drops that have at least three months of data after them, the results split into two pictures. The first is the one most people remember. Three months after the drop, the index was higher 67% of the time, or 32 of 48 cases, with a median gain of 7.0% and an average gain of 11.3%.1 One month after, it was higher two-thirds of the time as well, with a median gain of 5.7%.1
The second picture is the one that matters for anyone who has to sit through the next three months. In 44 of the 48 cases, or 92%, the index traded below the drop-day close at some point in the following three months. The median lowest point was 13.3% below the close on the day of the drop. In 26 of the 48 cases, more than half, the index fell at least another 10% before the three months were up.1
Put simply, a 7% down day has usually not been the low. It has usually been a marker that volatility has arrived and will stay for a while, with sharp rallies and sharp declines in the same stretch. Even the cases that ended well, such as the drops in March 2020 and April 2025, went through more selling before they turned.1
The six-month and 12-month numbers are less friendly than the three-month ones. After six months the index was higher in 26 of 46 cases, or 57%, with a median gain of 4.7%. After 12 months it was also higher 57% of the time, with a median gain of 12.6%.1 The spread is wide. The 12-month outcomes range from a 55% loss after the April 2000 drop to a gain of about 190% after the February 1999 drop.1 The average is pulled around by a few huge years in both directions, which is why I look at the median and the hit rate instead.
The Years With Three Or More
The clustering is the more useful signal. Friday was the third 7% down day of 2026, after declines of 10.3% on June 5 and 7.9% on June 23.1 The index also fell 6.3% on July 1 and 6.7% on October 22, just short of the 7% line.1, 6 That makes five daily drops of 6% or more this year.
Since 1994 only six other years had three or more 7% down days: 2000, 2001, 2002, 2008, 2020 and 2025.1 In every one of those years, the index fell at least 35% below its prior record at the low. In 2020 the low was 35.0% below the record. In 2025 it was 39.7% below. In the four years tied to the dot-com bust and the financial crisis, the index was 60% to 87% below its 2000 peak at the low.1 So far in 2026, the deepest close has been 28.6% below the June record.1
The outcomes split cleanly into two groups. In 2000, 2001, 2002 and 2008, the index finished the calendar year down 18.2%, 9.4%, 44.6% and 48.0%. In 2020 and 2025 it finished up 51.1% and 42.2%.1 The first group were earnings recessions for the industry. The second group were shocks that hit fast and faded fast, and the index made new highs within months.
The question for 2026 is which group this year belongs to. That is not something a price series can answer by itself, but the details of this selloff give some clues.
Why This Looks More Like A Spending Scare Than A Shock
The selling in 2020 came from a pandemic that shut down the economy, and the Federal Reserve cut its target range by a combined 1.50 percentage points in two moves in March 2020.9 The April 2025 drops came in a single week, and three months after the April 3 drop, the index was 42.3% higher.1 Both were sudden events that markets could price, then price out.
The selling in October 2026 has a different shape. It has come in waves tied to company results and spending plans. The index posted eight straight losing sessions through October 16, its longest streak since October 2008.5 It fell 6.7% on October 22 after a supply-chain warning from Lam Research, and then 7.2% on October 30 after Intel and Amazon reported.6, 3 The theme has been the same each time: whether the money being spent on AI infrastructure will earn a return, and how much of that spending is being financed with debt.5, 4
That matters because it ties chip stocks to the earnings and cash flow of their largest customers. A shock tends to pass. A rethink of capital spending budgets tends to play out over several quarters, as companies report and revise their plans. In my view, that makes 2026 more likely to see the drawn-out, volatile path of a capital spending cycle than the quick V of 2020 or 2025.
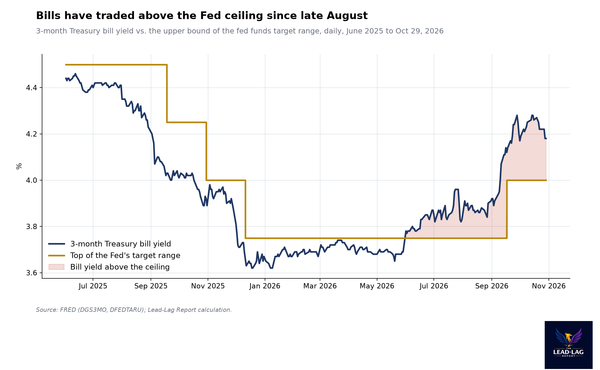
The policy backdrop also differs. The Fed raised its target range in September, held at 3.75% to 4% on October 28, and two officials voted for another hike.8, 9 In 2020 the Fed was cutting hard into the decline. In 2000, by contrast, it was raising rates into the top of the market, and the target reached 6.50% in May 2000.9 I do not think 2026 is 2000. The index is up 51% this year, not trading at the end of a five-year mania. But a Fed that is leaning toward tightening does not provide the cushion that a cutting Fed did in 2020.
The Trend Has Already Turned
The technical picture has shifted with the fundamentals. On Friday the index closed at 10,688.80, below its 200-day average of about 10,781.1 CNBC reported that the two most widely held chip ETFs moved below their 200-day averages for the first time since late May and early June 2025.10 That is the first break of the long-term trend since mid-2025.
The relative trend has broken as well. Measured against the S&P 500, the chip index is still up 36.3% this year, but it is 28.0% below its relative high on June 22.1, 7 Since June, the group that led the market has given back more than a quarter of its relative gain.
None of this says the AI buildout is over. Intel's own results showed data center and AI revenue up 78% from a year earlier alongside a 5% decline in its PC chip business, and Nvidia fell far less than Intel on Friday.14, 2 What it says is that the market has stopped paying for growth without asking about cost, and that is a harder environment for the stocks most exposed to the spending.
What This Means For Portfolios
The base rate argues against two common reactions. The first is to assume Friday was the capitulation. In 92% of past cases, it was not. The index usually traded lower within three months, and more often than not it fell another 10% or more.1 The second is to assume the decline will run straight down. In two-thirds of past cases, the index was higher three months later.1 The usual path has been a lower low, then a rally, with both happening in a short window.
For investors with large holdings in semiconductors, whether through single stocks, sector funds or growth-heavy index funds, the practical question is sizing. A group that can move 7% in a day, five times this year by 6% or more, is carrying more risk than its weight in an index suggests. The S&P 500 fell only 0.9% in October while the chip index fell 15.4%.1, 7 That gap shows how much of the volatility has been concentrated in one part of the market.
For income-focused investors, the main channel is indirect. A deeper drawdown in technology tends to tighten financial conditions and can feed into credit spreads, especially for companies that have borrowed to build. I wrote recently about how the index stopped buying back its own shares and started borrowing to build, and Friday's selling was the market's verdict on that shift.12
The Case Against Me
The strongest argument against my view is the base rate itself. Two-thirds of the time, the index was higher three months after a 7% drop, and the median gain was 7.0%.1 Someone who simply held through every one of these days would have done well more often than not. The June 5 drop this year is a recent example: the index made a new record close on June 22, about two weeks later.1
The second argument is that 2025 is the closer analog. That year also had four 7% down days, a decline of almost 40% from the prior record, and a full recovery to new highs, with the index finishing the year up 42.2%.1 If the October selloff turns out to be a positioning flush after a 51% run, rather than a turn in spending plans, the path could look like 2025 again.
The third argument is that the spending has not actually stopped. Companies are still committing to large data center budgets, and a selloff driven by worries about cash flow can reverse quickly if the next round of results shows that the spending is paying off. If that happens, the market will likely treat October as an overreaction.
What Would Change My View
I am watching three things. First, if the index closes back above its 200-day average, around 10,781 on Friday, and holds there for several weeks, the trend break will have failed, and the 2025 analog becomes more likely.1
Second, if the index makes it through the next three months without trading below Friday's close of 10,688.80, this case will join the small minority, four of 48, where a 7% drop marked the low right away.1
Third, if the S&P 500 begins to fall as fast as the chip index, the issue is no longer about one group. It becomes a broader market problem, and the analogs from 2000 to 2002 and 2008 carry more weight. So far, the S&P 500's October loss of 0.9% says the problem has stayed contained.7
How This Fits What I Have Written
This piece follows two recent Macro Observations. "Defensives Beat the S&P 500 by 8% in a Month. Eleven of 15 Times, a Drawdown Followed." argued that the rotation into defensive sectors was an early warning of equity weakness.11 The chip selloff is where that weakness has shown up first. "The Index Stopped Buying Itself. Now It Borrows to Build." looked at how the largest companies have shifted from buybacks to debt-funded capital spending, which is the same theme behind Friday's reaction to Amazon and Intel.12 And "Tech Falls From Three Sigma. Credit Is the Vote That Counts." made the case that credit markets, not equity prices, would decide whether the technology selloff spreads.13
The Takeaway
The chip index lost 7.2% on Friday, its third 7% down day of 2026, and it now sits 27% below its June record while still up 51% for the year.1 History says a day like this is usually followed by more selling within three months, and only then by a recovery. Every other year with three of these days saw a decline of 35% or more from the record. Whether 2026 ends like 2020 and 2025 or like 2000 and 2008 depends on whether the AI spending boom is pausing or turning. My read is that the market is starting to price a slower, more expensive buildout, and that the volatility is not done.
Annual paying members get a free print copy of The Price of a Quiet Yen or Intermarket Analysis and Investing, Third Edition (retail value up to $44.95, U.S. shipping): leadlagreport.com/annual. If you have read either book, an honest Amazon review helps other readers find it: The Price of a Quiet Yen and Intermarket Analysis and Investing.
Notes
- [1] Philadelphia Semiconductor Index (^SOX) daily closes, May 1994 to Oct 30, 2026, via Yahoo Finance. Drop counts, forward returns, drawdowns and 200-day average are Lead-Lag Report calculations: finance.yahoo.com/quote/%5ESOX/history/
- [2] Reuters via The Charlotte Observer, "Wall Street closes sharply lower as AI cash burn fears spark tech selloff," October 30, 2026 (chips index shed 7.2%, monthly loss of more than 15%): www.charlotteobserver.com/news/nation-world/national/article317845088.html
- [3] Reuters via The Wichita Eagle, "Intel on course for worst day ever, triggers global chip rout," October 30, 2026: www.kansas.com/news/business/article317846922.html
- [4] Seoul Economic Daily, "Nasdaq Falls 2.9% on AI Spending Fears; Intel Plunges 29%," October 31, 2026 (Intel down 28.58%, Amazon free cash flow and capital spending): en.sedaily.com/international/2026/10/31/nasdaq-falls-29-percent-on-ai-spending-fears-intel-plunges
- [5] Investing.com via Yahoo Finance, "Chip index SOX posts longest losing streak since 2008," October 2026: finance.yahoo.com/technology/ai/articles/chip-index-sox-posts-longest-123436535.html
- [6] Tech Times, "Chip Stocks Lose $200 Billion as Equipment Maker's Warning Counters Nvidia's AI Optimism," October 23, 2026 (index down 6.72% on October 22): www.techtimes.com/articles/329406/20261023/chip-stocks-lose-200-billion-equipment-makers-warning-counters-nvidias-ai-optimism.htm
- [7] S&P 500 (^GSPC) and Nasdaq Composite (^IXIC) daily closes via Yahoo Finance; Lead-Lag Report calculations: finance.yahoo.com/quote/%5EGSPC/history/
- [8] Federal Reserve FOMC statement, October 28, 2026: www.federalreserve.gov/newsevents/pressreleases/monetary20261028a.htm
- [9] Board of Governors of the Federal Reserve System, Federal Funds Target Range, Upper Limit (DFEDTARU) and Federal Funds Target Rate (DFEDTAR), via FRED: fred.stlouisfed.org/series/DFEDTARU
- [10] CNBC, "Stock market rocked as investors dump tech shares, Nasdaq drops 3%: Live updates," October 30, 2026: www.cnbc.com/2026/10/29/stock-market-today-live-updates.html
- [11] The Lead-Lag Report, "Defensives Beat the S&P 500 by 8% in a Month. Eleven of 15 Times, a Drawdown Followed.": www.leadlagreport.com/defensives-beat-the-s-p-500-by-8-in-a-month-eleven-of-15-times-a-drawdown-followed/
- [12] The Lead-Lag Report, "The Index Stopped Buying Itself. Now It Borrows to Build.": www.leadlagreport.com/the-index-stopped-buying-itself-now-it-borrows-to-build/
- [13] The Lead-Lag Report, "Tech Falls From Three Sigma. Credit Is the Vote That Counts.": www.leadlagreport.com/tech-falls-from-three-sigma-credit-is-the-vote-that-counts/
- [14] Quartz, "Intel stock plunges about 30%, Amazon slips as Nasdaq 100 faces loss of over $1.5 trillion," October 30, 2026: qz.com/intel-stock-plunges-amazon-nasdaq-100-sell-off-103026