Households Saved 3.8% of Their Income in September. Card Balances Did the Rest.
The saving rate fell to its lowest since October 2022 as real income dropped, and revolving credit jumped $16.3 billion in one month.


Complimentary for advisors today: Advisor Dinner Planner

Plan a dinner that fills seats with the right guests. A complete pack for one in-person advisor dinner: concept, venue plan, guest strategy and invitations, sponsor options, run of show, budget planner and follow-up.
What you receive
- Dinner concept and theme
- Venue plan
- Guest-list strategy and invitation copy
- Sponsor alignment
- Run of show
- Budget planner
Cost in credits: 4. Turnaround: 2-3 business days. Delivered as: an AI-prepared draft that you review. Best for: Advisors hosting a client or prospect dinner in their market.
It is complimentary for advisors. There is no invoice from us. You earn the credits by showing up: attend a sponsored Lead-Lag Media webinar, meet a fund issuer in a one-on-one introduction, or join one of our advisor dinners.
Prefer to browse first? See all 34 services at advisor.leadlagmedia.com.
Credits carry no cash value and are not payment for services. Drafts are prepared with AI assistance and are for your and your firm’s review before use; they are not investment, legal, tax or compliance advice, and nothing is guaranteed. Services are offered to financial advisors and are not a solicitation to retail investors.
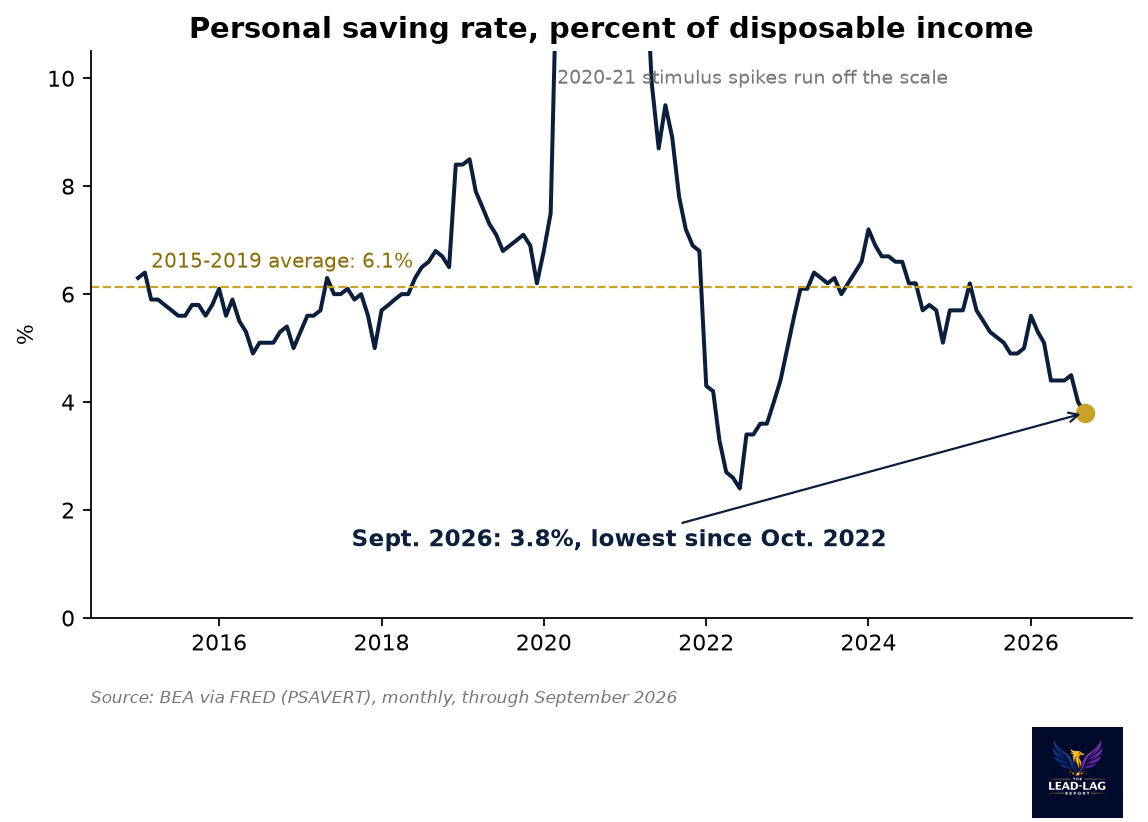
Households saved less of their income in September than at any point in almost four years, and they put more of their spending on credit cards.
The personal saving rate fell to 3.8% of disposable income in September, the Bureau of Economic Analysis reported on Oct. 29. It was 4.0% in August and 4.5% in July.[1] That is the lowest reading since October 2022, and well below the 6.1% average of 2015 through 2019.[2]
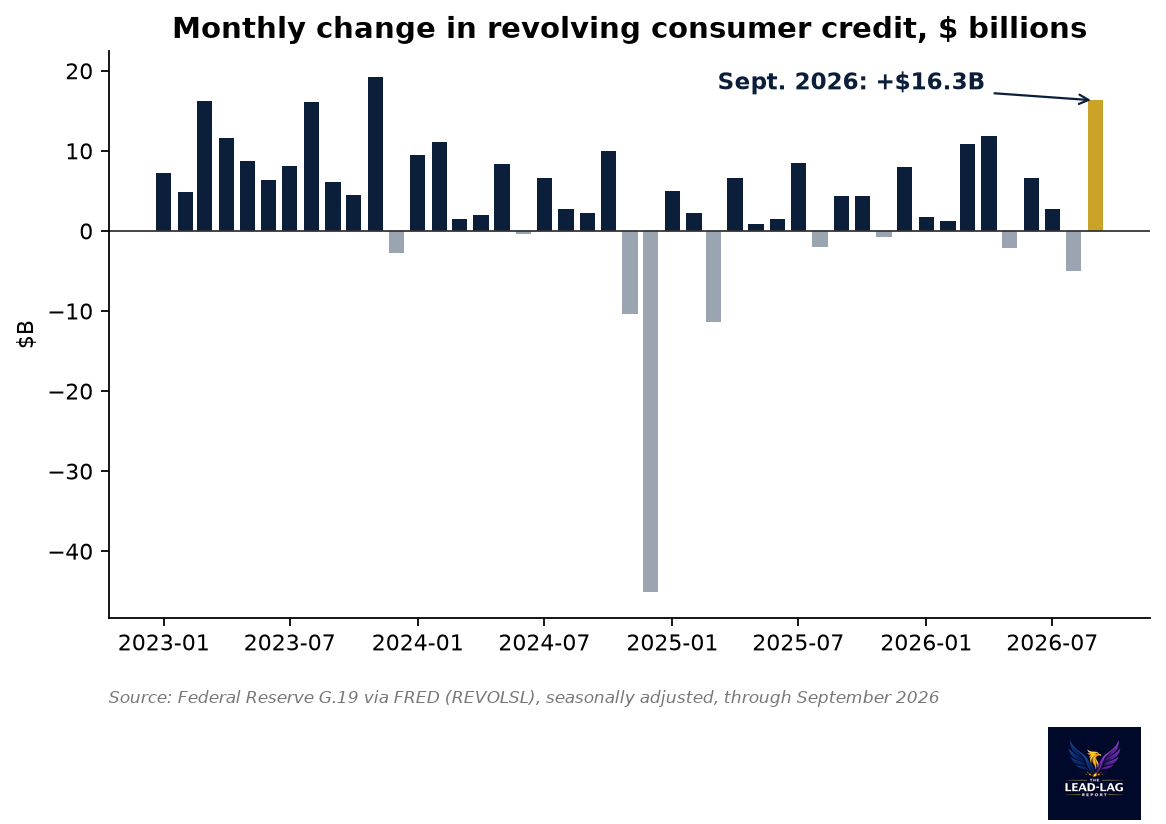
A week later the Federal Reserve's consumer credit report filled in how the gap was paid for. Revolving credit, which is mostly credit card balances, grew at a 14.5% annual rate in September.[3] In dollars that is about $16.3 billion in one month, the largest monthly gain since November 2023.[4]
Prices, not a spending spree
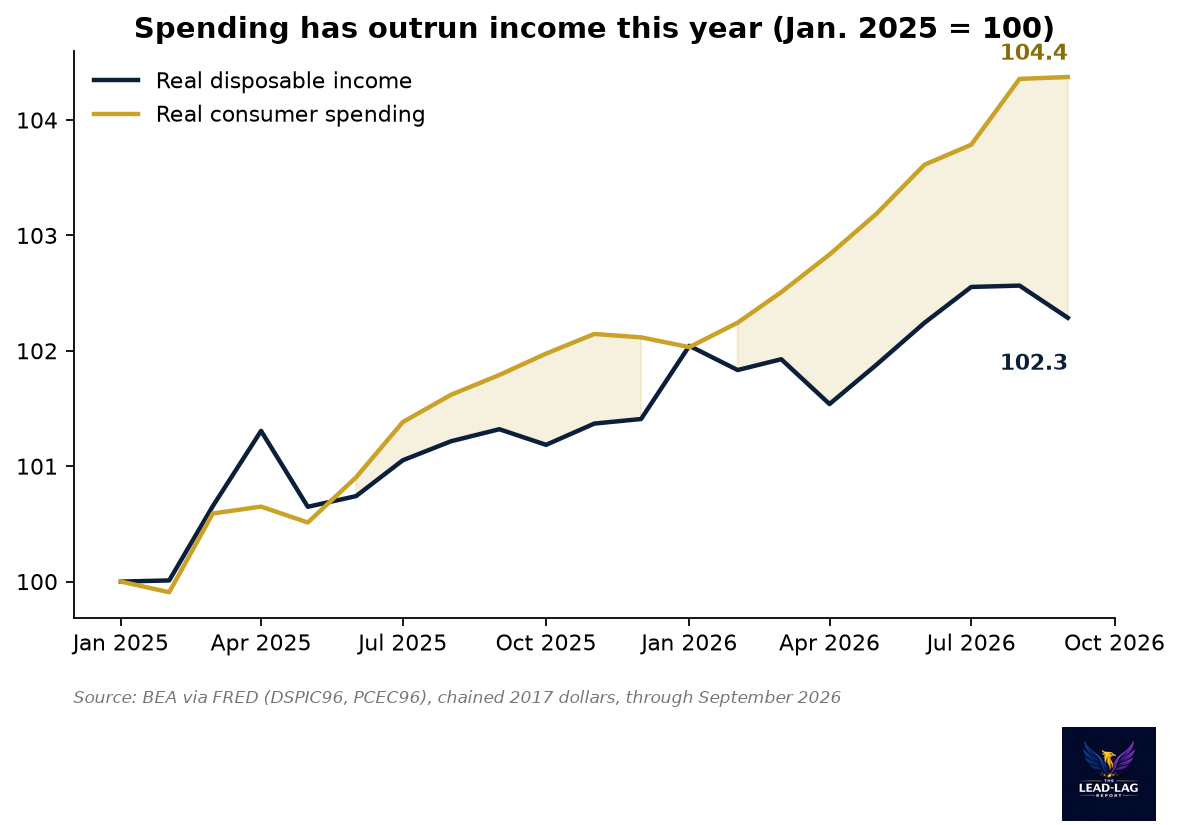
It is easy to read a falling saving rate as a sign that consumers feel flush. The September numbers do not support that reading. In current dollars, disposable income rose 0.2% and consumer spending rose 0.5%.[1] After adjusting for prices, real spending was flat, up 0.02% on the month, while real disposable income fell 0.27%.[5][6]
Put differently, households did not buy more things in September. They paid more for roughly the same things, and their paychecks did not keep up after inflation. The difference came out of saving and went onto credit cards.
This has been building all year. Since January 2025, real consumer spending is up 4.4% while real disposable income is up 2.3%.[5][6] Over the past 12 months the split is wider in growth terms: spending up 2.5% after inflation, income up about 1.0%.[5][6] A household can spend ahead of its income for a while by saving less. It cannot do it forever.
The card balance is the release valve
Total consumer credit grew at a 6.4% annual rate in September. Nonrevolving credit, such as auto and student loans, grew 3.6%. Revolving credit did most of the work at 14.5%.[3] Revolving balances now stand at about $1.37 trillion, up 4.2% from a year earlier.[4]
The month-to-month pattern matters here. Revolving credit fell by about $5.0 billion in August and rose by about $2.7 billion in July before September's jump.[4] One strong month does not make a trend, and the series is noisy. But the jump came in the same month real income fell, which is the combination worth watching.
Why it is not a crisis yet
The balance sheet behind these flows is still in decent shape. Household debt service payments took 11.11% of disposable income in the second quarter, close to where they have been for two years.[7] The delinquency rate on credit card loans at commercial banks was 2.85% in the second quarter, down from 3.20% in the third quarter of 2024.[8]
Those are not the numbers of a stressed borrower base. They describe households that took on more card debt from a position of manageable payments. The risk is in the direction, not the level.
The 2022 comparison, and why it does not fully apply
The last time the saving rate was this low, it went lower. It bottomed at 2.4% in June 2022.[2] That year real disposable income fell 4.5% over the 12 months to June, and revolving credit grew 15.4% over the full year.[4][6] Real spending kept growing anyway.
That history is the strongest argument against reading too much into September. Households have shown they will run their saving rate down to keep spending when prices jump, and the economy has absorbed it before.
The difference is the starting point. In 2022 households were drawing on savings built up during the pandemic, when the saving rate reached 26.2% in March 2021.[2] That cushion is gone. The saving rate has been below its 2015 to 2019 average for most of the past two years, so the current decline is coming off a lower base, with fewer reserves behind it.[2]
That is why the composition matters more this time. A low saving rate funded by excess savings is a drawdown. A low saving rate funded by card balances is a loan.
What would change the view
Two readings would ease the concern. One is a month or two of real disposable income growth, which would show the September decline was a price spike rather than a trend. The other is revolving credit growth falling back toward the 4.2% pace of the past year.[4] Either would suggest households are adjusting rather than stretching.
What it means for markets
Consumer spending is the largest piece of the economy, so the question is how long it can keep growing faster than real income. There are three ways the gap closes. Income growth after inflation picks up, which needs either faster wage gains or slower price increases. Households save even less and borrow more, which has limits. Or spending slows to match income.
For investors, the first path is the benign one, and it runs through inflation. The second path supports growth now and makes the economy more sensitive to rates later, because card balances carry floating rates. The third path is the one that would show up first in retail sales and in earnings guidance from consumer-facing companies.
Sentiment already leans toward the third. The University of Michigan consumer sentiment index was 48.1 in September, down from 55.2 in July.[9] Households that feel this way while their saving cushion shrinks tend to pull back when the next shock arrives.
The next personal income report is due Nov. 25.[1] The thing to watch is not the saving rate on its own. It is whether real disposable income starts growing again. If it does, the low saving rate is a temporary squeeze. If it does not, September's card balance was a preview.
Notes
[1] U.S. Bureau of Economic Analysis, "Personal Income and Outlays, September 2026," released Oct. 29, 2026: https://www.bea.gov/news/2026/personal-income-and-outlays-September-2026. Personal income +0.2%, disposable personal income +$52.7 billion (+0.2%), PCE +$113.1 billion (+0.5%), personal saving $911.1 billion, saving rate 3.8%; next release Nov. 25, 2026.
[2] Personal Saving Rate, BEA via FRED, series PSAVERT: https://fred.stlouisfed.org/series/PSAVERT. 4.5 (July 2026), 4.0 (August 2026), 3.8 (September 2026); 26.2 (March 2021); 2.4 (June 2022, 2022 low); 3.6 in October 2022 was the last reading at or below 3.8; 2015 to 2019 average 6.1.
[3] Board of Governors of the Federal Reserve System, G.19 Consumer Credit, September 2026, released Nov. 6, 2026: https://www.federalreserve.gov/releases/g19/current/default.htm. Total 6.4%, revolving 14.5%, nonrevolving 3.6% (annual rates); revolving flow $195.6 billion at an annual rate.
[4] Revolving Consumer Credit Owned and Securitized, Federal Reserve via FRED, series REVOLSL: https://fred.stlouisfed.org/series/REVOLSL. Monthly change +$2.7 billion (July 2026), -$5.0 billion (August 2026), +$16.3 billion (September 2026), largest since +$19.2 billion in November 2023; level $1.368 trillion, +4.2% year over year; +15.4% December 2021 to December 2022.
[5] Real Personal Consumption Expenditures, chained 2017 dollars, BEA via FRED, series PCEC96: https://fred.stlouisfed.org/series/PCEC96. +0.02% in September 2026; +2.5% year over year; +4.4% since January 2025; +2.2% June 2021 to June 2022.
[6] Real Disposable Personal Income, chained 2017 dollars, BEA via FRED, series DSPIC96: https://fred.stlouisfed.org/series/DSPIC96. -0.27% in September 2026; +1.0% year over year; +2.3% since January 2025; -4.5% June 2021 to June 2022.
[7] Household Debt Service Payments as a Percent of Disposable Personal Income, Federal Reserve via FRED, series TDSP: https://fred.stlouisfed.org/series/TDSP. 11.11 (Q2 2026).
[8] Delinquency Rate on Credit Card Loans, All Commercial Banks, Federal Reserve via FRED, series DRCCLACBS: https://fred.stlouisfed.org/series/DRCCLACBS. 3.20 (Q3 2024), 2.85 (Q2 2026).
[9] University of Michigan: Consumer Sentiment, via FRED, series UMCSENT: https://fred.stlouisfed.org/series/UMCSENT. 55.2 (July 2026), 48.1 (September 2026).
Paid members get the full Weekly Signals, the weekly Leaders and Laggards and every chart behind each call. Start with 7 days free.
The Lead-Lag Report is provided by Lead-Lag Publishing, LLC. All opinions and views mentioned in this report constitute our judgments as of the date of writing and are subject to change at any time. Information within this material is not intended to be used as a primary basis for investment decisions and should also not be construed as advice meeting the particular investment needs of any individual investor. Trading signals produced by the Lead-Lag Report are independent of other services provided by Lead-Lag Publishing, LLC or its affiliates, and positioning of accounts under their management may differ. Please remember that investing involves risk, including loss of principal, and past performance may not be indicative of future results. Lead-Lag Publishing, LLC, its members, officers, directors and employees expressly disclaim all liability in respect to actions taken based on any or all of the information on this writing.