
The Cheap Insurance Regime
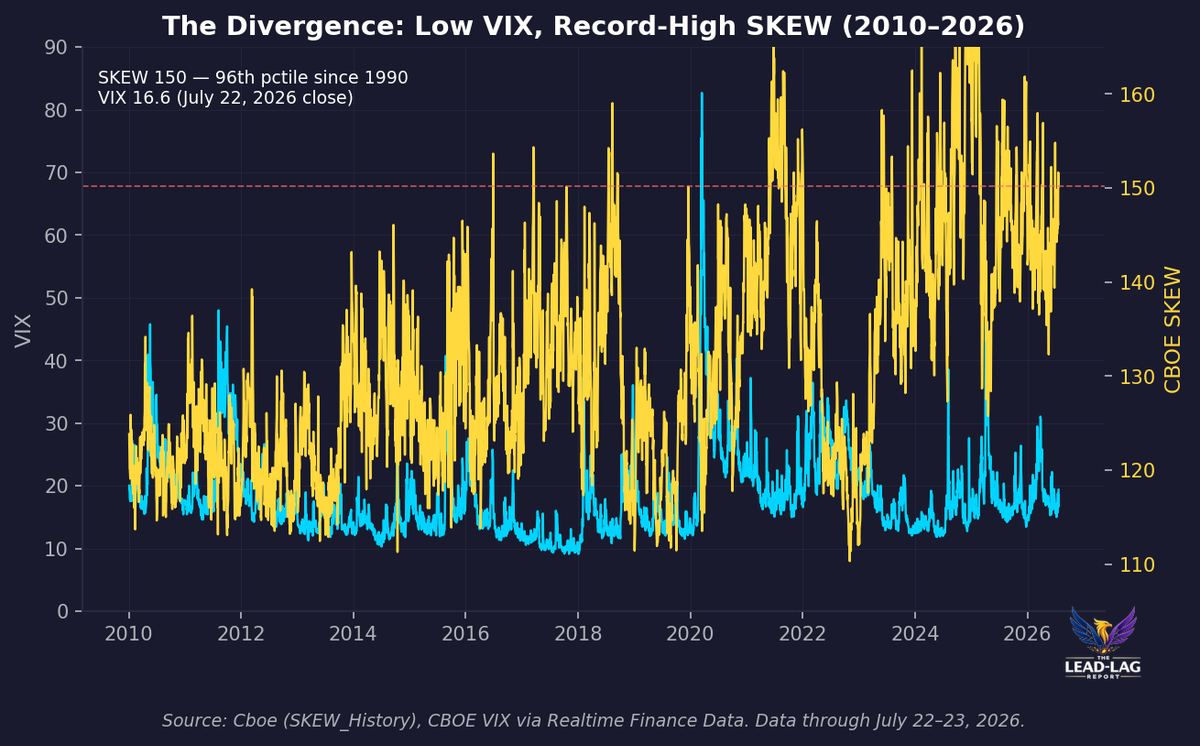
The CBOE SKEW index closed at 150 on July 22, its 96th percentile reading since 1990, while the VIX sat near 16 — a divergence, not a coincidence.

Today’s Lead-Lag Report post is sponsored by Manifesting Algorithm

111,000+ people paid over $1,000 for the recording of one closed-door lecture on how the wealthy manifest what they want. Right now it's free — the full audio plus the new 500-page manuscript.
“Your Wish Is Your Command” was recorded at a private event in the Swiss Alps. Kevin Trudeau’s premise: the Law of Attraction fails because your brain broadcasts on the wrong frequency — and the fix is learnable. Full audio + the rewritten 500-page e-book, free.
DISCLAIMER – PLEASE READ: This is sponsored advertising content for which Lead-Lag Publishing, LLC is being paid a fee. The information provided is solely the creation of Manifesting Algorithm. Lead-Lag Publishing, LLC does not guarantee the accuracy or completeness of the information provided or make any representation as to its quality. All statements and expressions provided are the sole opinion of Manifesting Algorithm and Lead-Lag Publishing, LLC expressly disclaims any responsibility for action taken in connection with the information provided.
The Cheap Insurance Regime
When low VIX and high skew mean the market is mispricing tails
Key Highlights
- The CBOE SKEW index closed at 150 on July 22, its 96th percentile reading since 1990, while the VIX sat near 16 — a divergence, not a coincidence.
- VVIX, the vol-of-vol gauge, sits above 95 and in its top quartile since 2010. The market is not calm about volatility; it is calm about the spot tape.
- 0DTE options have grown from roughly 5% of SPX volume in 2016 to a record 61% in May 2025. A structural seller base has swelled beneath the surface.
- Options-based ETF assets went from about $5 billion in 2018 to $272 billion at the end of 2025. Selling convexity has become a crowded consensus.
- Every prior instance of low VIX paired with elevated SKEW — August 2015, February 2018, February 2020 — was followed by a violent volatility repricing within months.
A low VIX is supposed to mean calm. That is the reflex. The screen shows a 16 handle, the headlines call it complacency, and everyone moves on. The reflex is wrong. The most important volatility signal in the market right now is not the level of the VIX. It is the gap between the VIX and everything sitting behind it.
The CBOE SKEW index closed at 150 on July 22.[1] That is the 96th percentile of every daily reading since 1990.[2] On the same day the VIX closed near 16.6.[3] Those two numbers are not supposed to travel together. When they do, it is telling you something specific: the market is pricing the body of the distribution as calm and the tail of the distribution as dangerous. That is not complacency. That is a bet on convexity that has quietly become one-sided.
The consensus is reading one number and ignoring four
The consensus narrative is simple and lazy. VIX low equals calm. It fits on a chyron. It requires no thought. And it collapses the moment you look at what the options market is actually paying for.
The VIX measures at-the-money implied volatility on the S&P 500 over the next 30 days. It tells you what traders will pay to hedge the middle of the distribution. SKEW measures the price of the tail — the cost of far-out-of-the-money puts relative to at-the-money options. When SKEW rises while VIX stays low, it means the same market that shrugs at a normal-sized move is paying up, aggressively, for protection against an abnormal one. The center looks cheap. The wings look expensive. That is the definition of a distribution the market believes is fat-tailed and left-skewed.
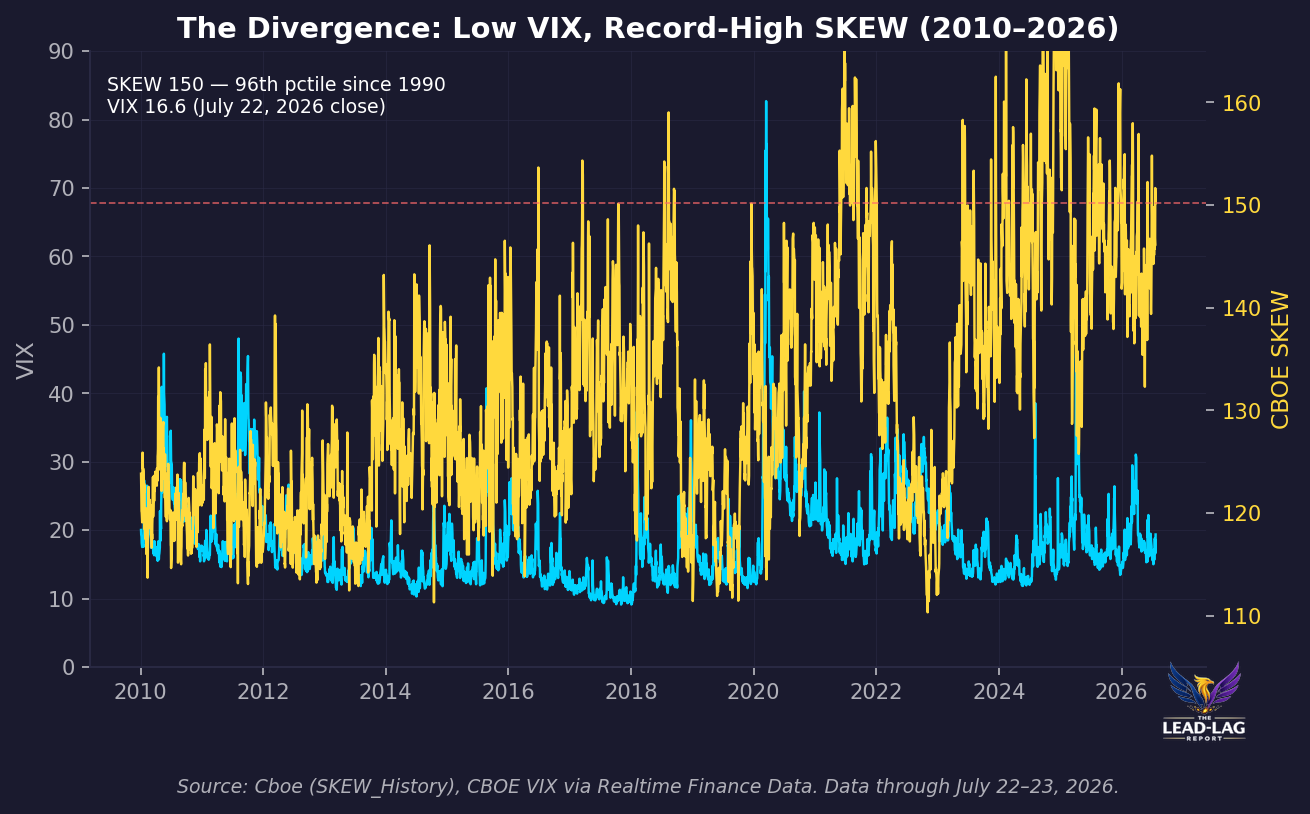
Look at the chart. The gold line, SKEW, is pinned near the top of its sixteen-year range. The blue line, VIX, is sitting in the lower third of its distribution. The current SKEW reading ranks in the 96th percentile of history.[2] The VIX, by contrast, has spent most of the year in the teens. This is not a market that has stopped worrying. It is a market that has decided precisely where to worry — in the tail — and is paying for it there while selling the center to fund the trade.
Vol-of-vol is not cheap, either
If the low VIX truly meant calm, VVIX — the volatility of the VIX itself — would be low too. It is not. VVIX closed above 95 this week and has traded above 100.[4] That sits in the top quartile of its readings since 2010. VVIX is the price of options on the VIX. A high VVIX means traders are paying up for the right to own volatility exposure that pays off if volatility spikes. In plain terms: the market is calm about the tape and nervous about the nerves.
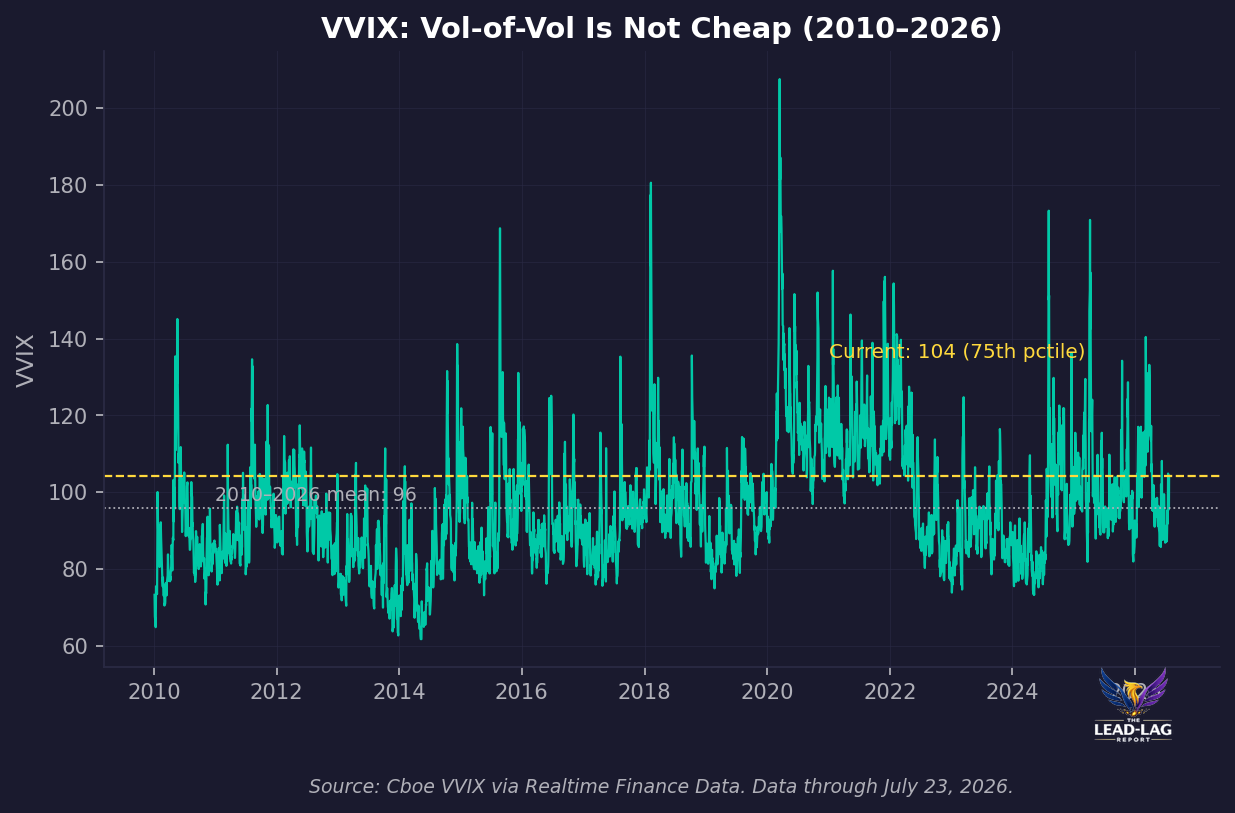
This is the internal contradiction the consensus refuses to hold in its head. Spot volatility is subdued. Second-order volatility is not. When the first derivative is quiet and the second derivative is loud, the quiet is borrowed. It is the calm of a market that has sold a lot of near-dated optionality and is holding its breath about the consequences.
The bond market is pricing more risk than the stock market
Cross-asset confirmation matters, and it is flashing. The MOVE index, which measures implied volatility in the Treasury market, closed near 76 on July 22 against a VIX near 16.6.[5] The ratio of bond vol to equity vol is elevated relative to its post-2010 norm. The fixed income market — larger, more institutional, less prone to retail euphoria — is pricing meaningfully more uncertainty than the equity vol surface implies.
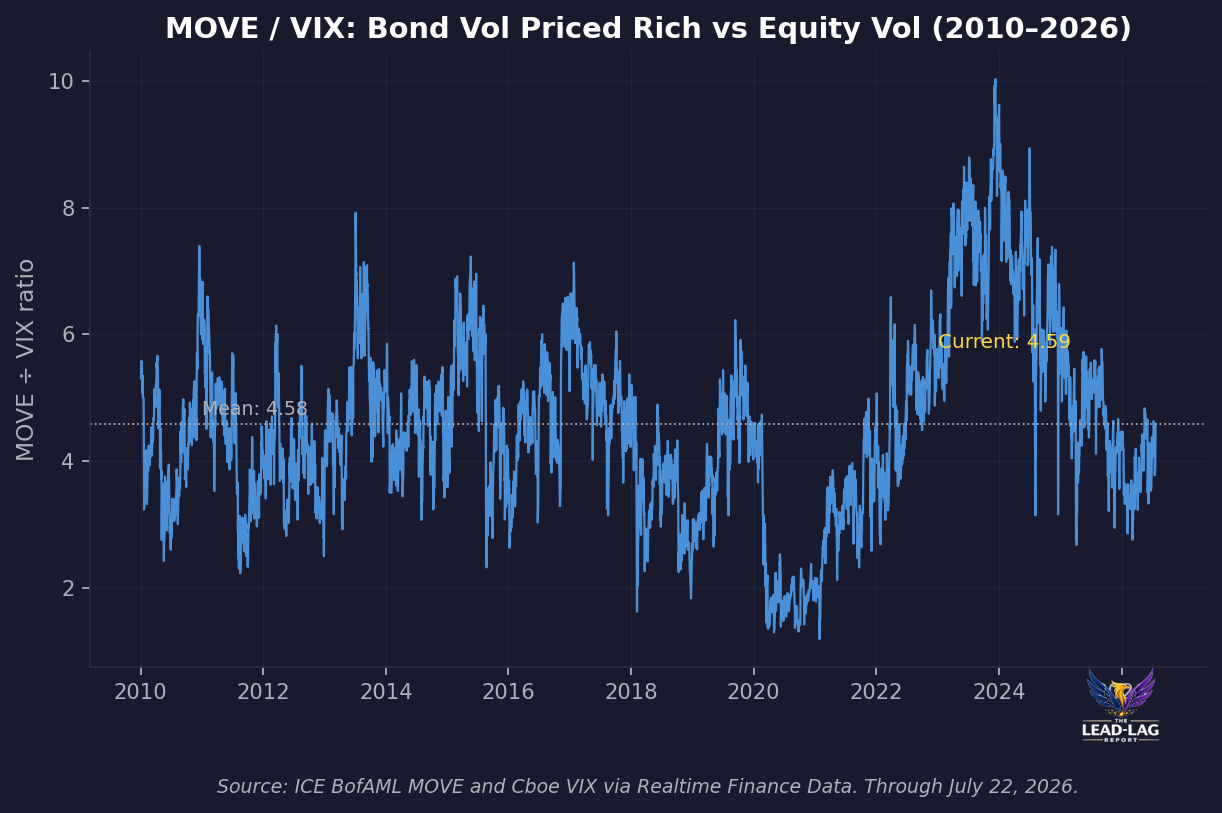
When bonds and stocks disagree about how much risk is in the system, the bond market usually turns out to have been right. Equity implied volatility is being manufactured lower by a supply dynamic that has nothing to do with fundamentals and everything to do with flow. That dynamic has a name.
The mechanism: a supply glut of convexity sellers
At-the-money equity volatility is cheap because someone is manufacturing supply. The 0DTE options complex is the most visible symptom. Zero-days-to-expiry options have grown from roughly 5% of SPX volume in 2016 to 43% by the end of 2023, and to a record 61% in May 2025.[6] Average daily 0DTE volume reached about 3.2 million contracts in early 2026.[7] A large share of that flow is premium selling — traders and systematic strategies harvesting decay by writing short-dated options into the close.
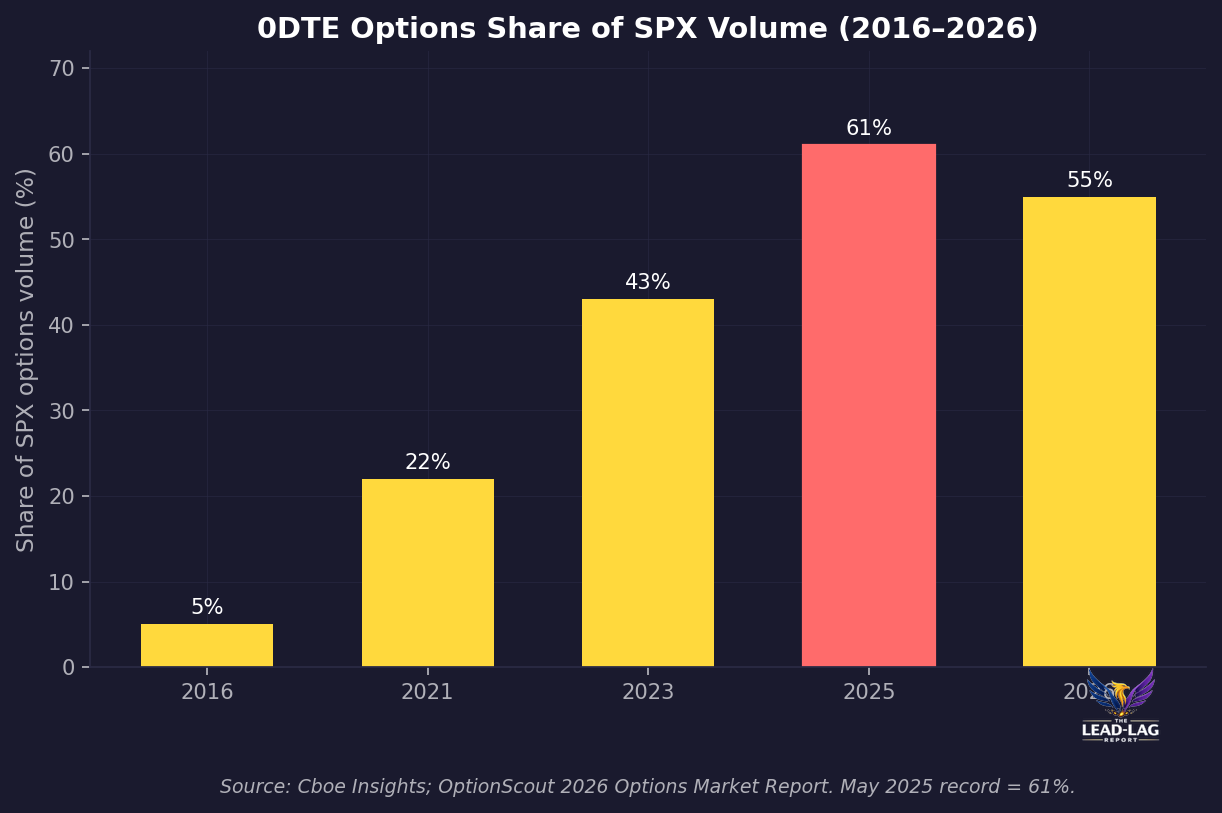
The structural story is bigger than 0DTE. The entire options-income ETF complex has exploded. Options-based ETF assets grew from roughly $5 billion in 2018 to $272 billion at the end of 2025.[8] A single fund, JPMorgan's Equity Premium Income ETF, holds more than $40 billion by selling equity-linked calls.[9] Net inflows into the category reached $82 billion in 2025 alone, up from about $0.3 billion in 2018.[8] These vehicles, along with structured products, dispersion books, and systematic overwriting programs, all do the same thing: they sell volatility to generate yield.
When a strategy holding over $100 billion does the same trade, it stops being a trade and becomes a regime. A supply glut of at-the-money volatility sellers compresses the center of the distribution. The tail, which these programs generally do not sell, prices separately — and prices high. That is the entire divergence in one sentence. The compression in the VIX and the elevation in SKEW are two faces of the same crowded position.
The historical parallel is exact, and it is not comforting
This setup has a track record. It is short, specific, and ugly.
In July 2015, SKEW ran to the mid-120s while the VIX sat around 12.[10] Within weeks the August 2015 flash selloff sent the VIX above 40. In late January 2018, the VIX was near 11 while short-volatility products had swelled to several billion dollars in assets.[11] On February 5, 2018 — the day the market called Volmageddon — the VIX more than doubled in a session and the flagship inverse-volatility product, XIV, was terminated after losing roughly 90% of its value.[11] In mid-January 2020, SKEW was elevated near 135 and the VIX sat near 12.[12] Six weeks later the VIX printed above 80 as COVID hit.
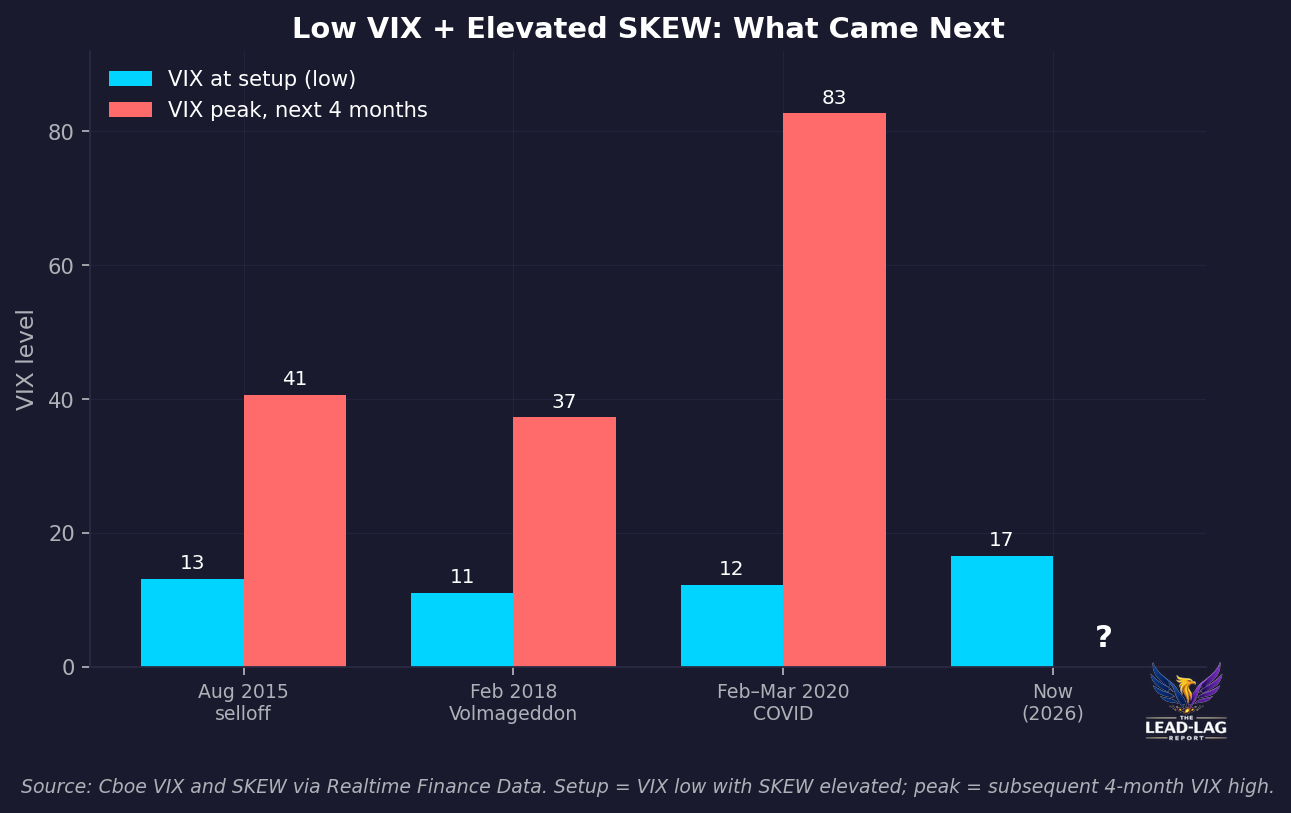
The pattern is not that low VIX causes crashes. Low VIX does not cause anything. The pattern is that a low VIX paired with an elevated SKEW and a crowded short-volatility base is a market that has pre-sold its own shock absorbers. When the move comes, the sellers who compressed volatility on the way down are forced to cover on the way up, and the same flow that manufactured calm manufactures the spike. The convexity that looked expensive in the tail turns out to have been the cheapest thing in the market.
Positioning: this is about asymmetry, not direction
None of this is a call on the direction of equities. The S&P can grind higher for months from here. That is exactly what a compressed-volatility regime tends to do right up until it does not. The observation is narrower and more durable: the price of convexity is low relative to the realized risk embedded in the structure of the market. Tail protection is pricing cheaply at the same moment the machinery that would force a violent repricing has grown to record size.
That is an asymmetric convex payoff regime. The cost of owning the tail is modest. The distribution of outcomes on the other side of a vol-seller unwind is not. When the carry of being short volatility is thin and the crowd on that side is this large, the interesting exposure is the one positioned for volatility expansion rather than the one collecting the last few basis points of premium decay. The asymmetry favors owning convexity, not renting yield against it.
What would prove this wrong
A thesis that cannot be falsified is not a thesis; it is a mood. So here is the kill switch. If SKEW normalizes back into the 118 to 125 range while the VIX holds below 15 for 60 or more consecutive days, this observation is wrong.[1] That combination would not be compression — it would be a genuinely stable, low-tail-risk regime in which the options market and the realized tape agree. In that world, the divergence resolves benignly, the crowded short-vol trade keeps paying, and the cheap insurance simply expires worthless the way most insurance does. I do not think that is what is coming. But that is the print that would settle it.
The VIX is not telling you the market is calm. It is telling you that a very large number of participants have sold the same insurance policy, that the buyers of tail protection are paying up in the wings even as the sellers compress the center, and that the last three times this configuration appeared it ended with a repricing that was fast, violent, and obvious only in hindsight. The insurance is cheap. The risk is not.
Few understand this.
— — —
Notes
[1] Cboe Global Indices, SKEW Index history (SKEW_History.csv), close of 150.19 on July 22, 2026, and normal SKEW range reference. https://cdn.cboe.com/api/global/us_indices/daily_prices/SKEW_History.csv
[2] Author's calculation from Cboe SKEW daily history, 1990–2026: July 22, 2026 reading ranks in the 96th percentile of all daily closes. https://cdn.cboe.com/api/global/us_indices/daily_prices/SKEW_History.csv
[3] CBOE Volatility Index (VIX) daily close, 16.64 on July 22, 2026, via Realtime Finance Data (Cboe source). https://www.cboe.com/tradable_products/vix/
[4] Cboe VVIX Index, close of 95.55 on July 22 and 104.29 on July 23, 2026, top-quartile since 2010, via Realtime Finance Data. https://www.cboe.com/us/indices/dashboard/vvix/
[5] ICE BofAML MOVE Index, close near 76.3 on July 22, 2026, against VIX near 16.6, via Realtime Finance Data. https://indices.theice.com/
[6] Cboe Insights, “SPX 0DTE Options Jump to 61% Share on Retail Resurgence,” May 2025 record share; 43% at end of 2023; ~5% in 2016. https://www.cboe.com/insights/posts/spx-0-dte-options-jump-to-61-share-on-retail-resurgence/
[7] OptionScout, “2026 Options Market Report,” average daily 0DTE volume ~3.2 million contracts in Q1 2026. https://optionscout.ai/blog/2026-options-market-report
[8] BlackRock / Morningstar, outcome and options-based ETF assets rose from about $5 billion in 2018–2019 to $272 billion at year-end 2025; category net inflows of $82.4 billion in 2025 vs $0.3 billion in 2018. https://www.ishares.com/us/insights/outcome-etfs-income-strategies
[9] Moontower / ETF.com, JPMorgan Equity Premium Income ETF (JEPI) assets over $40 billion via covered-call-equivalent strategy; options-income ETFs held $112 billion across 151 funds at year-end 2025. https://moontower.substack.com/p/incomestkd-anatomy-of-a-next-generation
[10] Author's calculation from Cboe SKEW and VIX history: mid-July 2015 SKEW ~125 with VIX ~12; VIX peaked above 40 during the August 2015 selloff. https://cdn.cboe.com/api/global/us_indices/daily_prices/SKEW_History.csv
[11] CFA Institute Research and Policy Center, “Volmageddon and the Failure of Short Volatility Products”; VIX near 11 in late January 2018, more than doubled on February 5, 2018, and XIV lost ~90% and was terminated. https://rpc.cfainstitute.org/research/financial-analysts-journal/2021/volmageddon-failure-short-volatility-products
[12] Author's calculation from Cboe SKEW and VIX history: mid-January 2020 SKEW ~135 with VIX ~12; VIX exceeded 80 in March 2020. https://cdn.cboe.com/api/global/us_indices/daily_prices/SKEW_History.csv
The Lead-Lag Report is provided by Lead-Lag Publishing, LLC. All opinions and views mentioned in this report constitute our judgments as of the date of writing and are subject to change at any time. Information within this material is not intended to be used as a primary basis for investment decisions and should also not be construed as advice meeting the particular investment needs of any individual investor. Trading signals produced by the Lead-Lag Report are independent of other services provided by Lead-Lag Publishing, LLC or its affiliates, and positioning of accounts under their management may differ. Please remember that investing involves risk, including loss of principal, and past performance may not be indicative of future results. Lead-Lag Publishing, LLC, its members, officers, directors and employees expressly disclaim all liability in respect to actions taken based on any or all of the information on this writing.



