
The Silent Loss
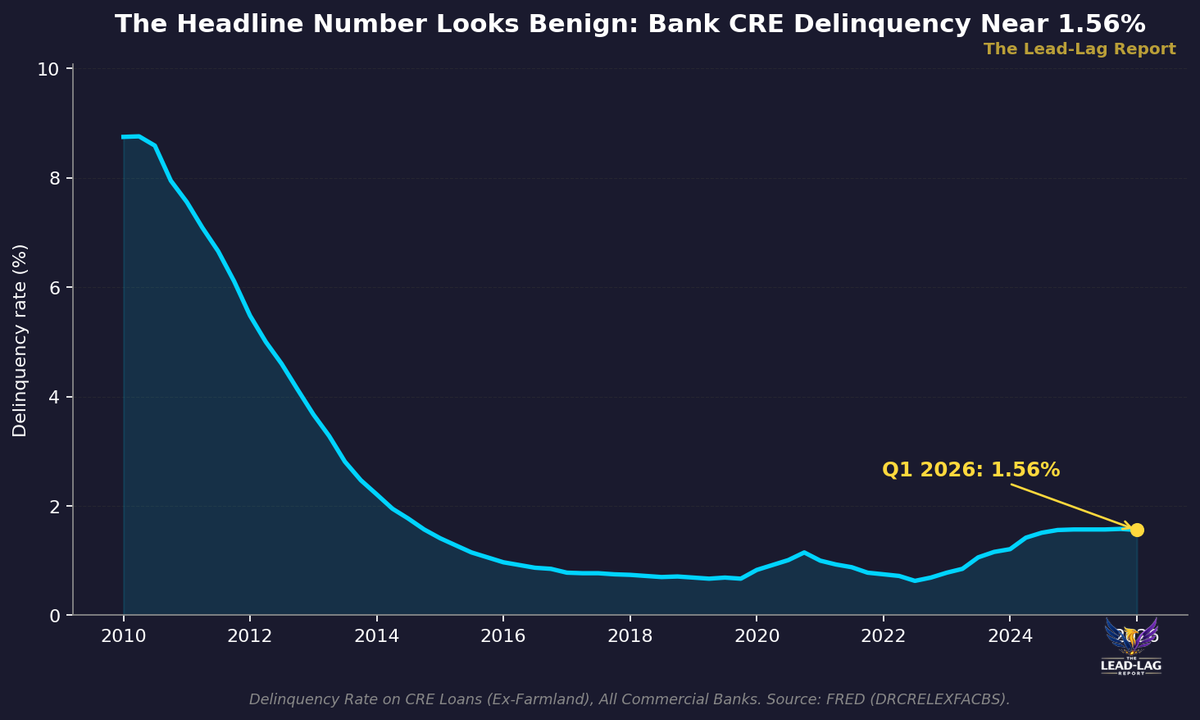
The aggregate delinquency rate on commercial real estate loans at all commercial banks sits near 1.56% as of the first quarter of 2026 — close to a cycle low, and the number consensus points to when it says CRE risk is contained.

Today’s Lead-Lag Report post is sponsored by Rivo

Rivo Puts The Cash In Your Bank Account To Work Automatically.
You have money sitting in your bank account that could be earning. But moving it around is a hassle. Rivo automatically moves the cash you are not using into U.S. government-backed assets and brings it back before your bills are due. Set it up once, and let Rivo do the work.
DISCLAIMER – PLEASE READ: This is sponsored advertising content for which Lead-Lag Publishing, LLC is being paid a fee. The information provided is solely the creation of Rivo. Lead-Lag Publishing, LLC does not guarantee the accuracy or completeness of the information provided or make any representation as to its quality. All statements and expressions provided are the sole opinion of Rivo and Lead-Lag Publishing, LLC expressly disclaims any responsibility for action taken in connection with the information provided.
The Silent Loss
How Regional Banks Are Grinding Down Under the CRE Maturity Wall
Key Highlights
- The aggregate delinquency rate on commercial real estate loans at all commercial banks sits near 1.56% as of the first quarter of 2026 — close to a cycle low, and the number consensus points to when it says CRE risk is contained.
- That same quarter, the office CMBS delinquency rate reached 12.34% in January 2026, an all-time high, surpassing the 11.76% peak of October 2025. Roughly an eight-to-one gap between the securitized office market and the reported bank book is not a rounding error — it is the tell.
- The Federal Reserve's 2026 stress test projects $76.5 billion of aggregate domestic CRE loan losses at an 8.8% portfolio loss rate over the 2026:Q1 to 2028:Q1 horizon. The severe scenario already knows where this is going.
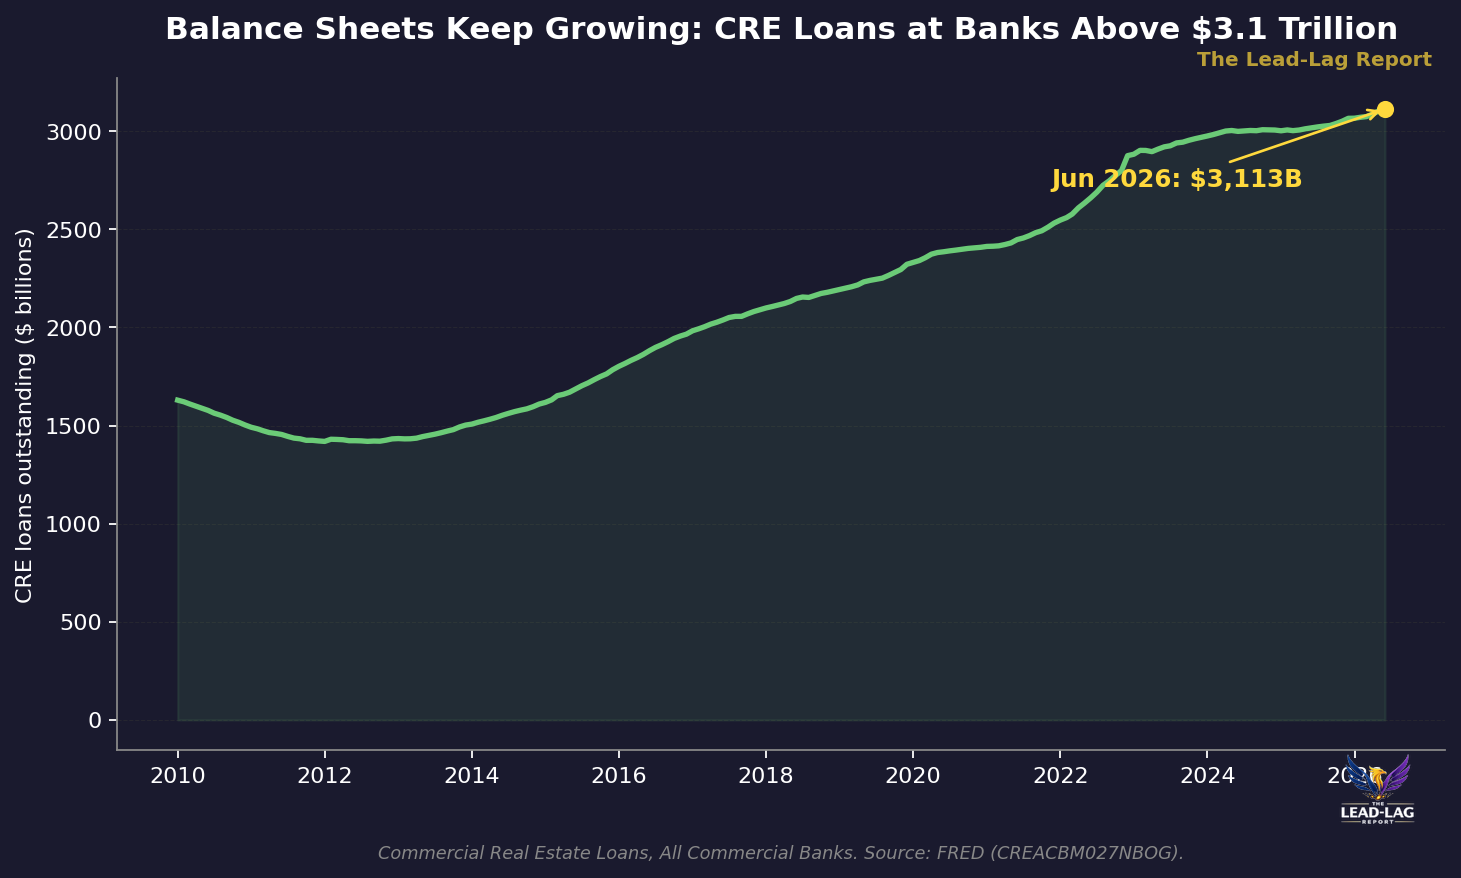
- CRE loans on bank balance sheets kept growing to about $3,112.66 billion in June 2026, and FDIC data show first-quarter loan growth led by nonfarm nonresidential CRE. Banks are extending and adding, not resolving.
- The mechanism is not a delinquency spike. It is extensions, higher refinancing coupons, and reserve build that eat earnings and tangible capital before defaults ever reach the headline delinquency rate.
A credit loss does not always announce itself. Sometimes it arrives as a headline default, a foreclosure, a bank that fails on a Friday afternoon. But more often, in a slow cycle, it arrives quietly — as a loan that gets extended one more time, a reserve that gets built one more quarter, a net interest margin that compresses because the borrower can only service the debt at a coupon that no longer covers the bank's own cost of funds. The loss is real. It is simply silent.
That is where the regional and community banks with heavy commercial real estate concentration are right now. The consensus view is comfortable and, on the surface, defensible: regional banks survived 2023, the delinquency data look fine, and the systemic risk is contained. I want to make the case that the comfortable read is looking at the wrong number.
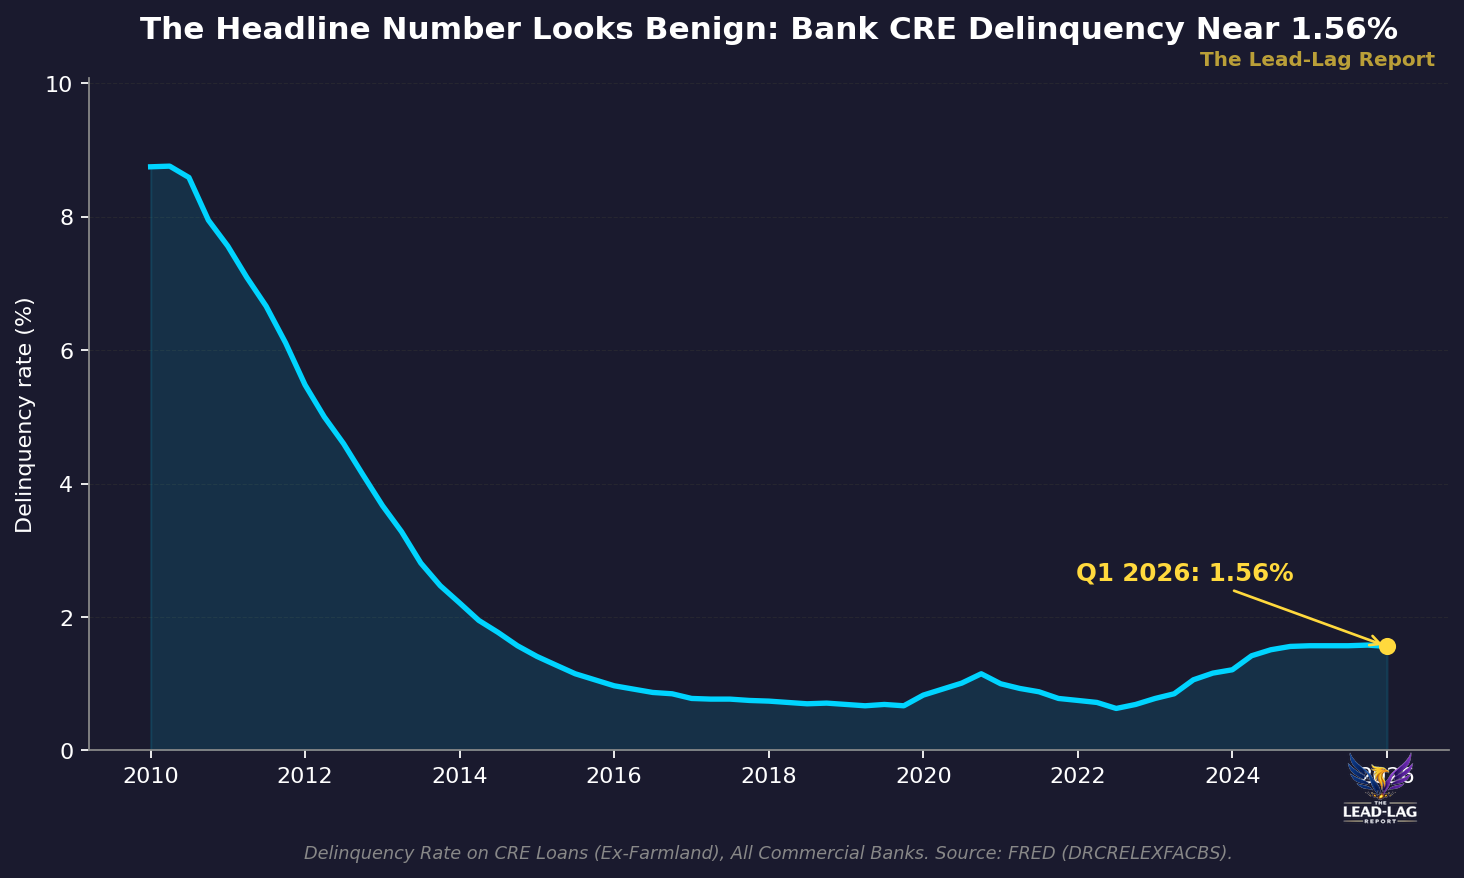
Start with the number everyone quotes. The delinquency rate on commercial real estate loans, excluding farmland, across all commercial banks was about 1.56% in the first quarter of 2026.[1] That is near the low end of the post-2010 range. If you stopped there, you would conclude that CRE stress is a media narrative, not a balance-sheet fact.
The Aggregate Hides the Concentration
The problem with a system-wide average is that it blends the healthy and the impaired into a single figure that describes neither. The 1.56% aggregate mixes the pristine multifamily book of a diversified money-center bank with the aging suburban office loan sitting on a community bank in a secondary market. The average is dominated by the largest, most diversified institutions. It is not the experience of the CRE-concentrated regional cohort, and it is not the experience of the asset class that is actually breaking.
Look at the securitized office market and the divergence is impossible to ignore. Trepp reported that the CMBS office delinquency rate hit 12.34% in January 2026, an all-time high, surpassing the 11.76% peak set in October 2025.[2] That is roughly eight times the aggregate bank CRE delinquency rate, in the same window. The securitized market marks its collateral to observable prices and recognizes distress quickly. The bank book does not have to.
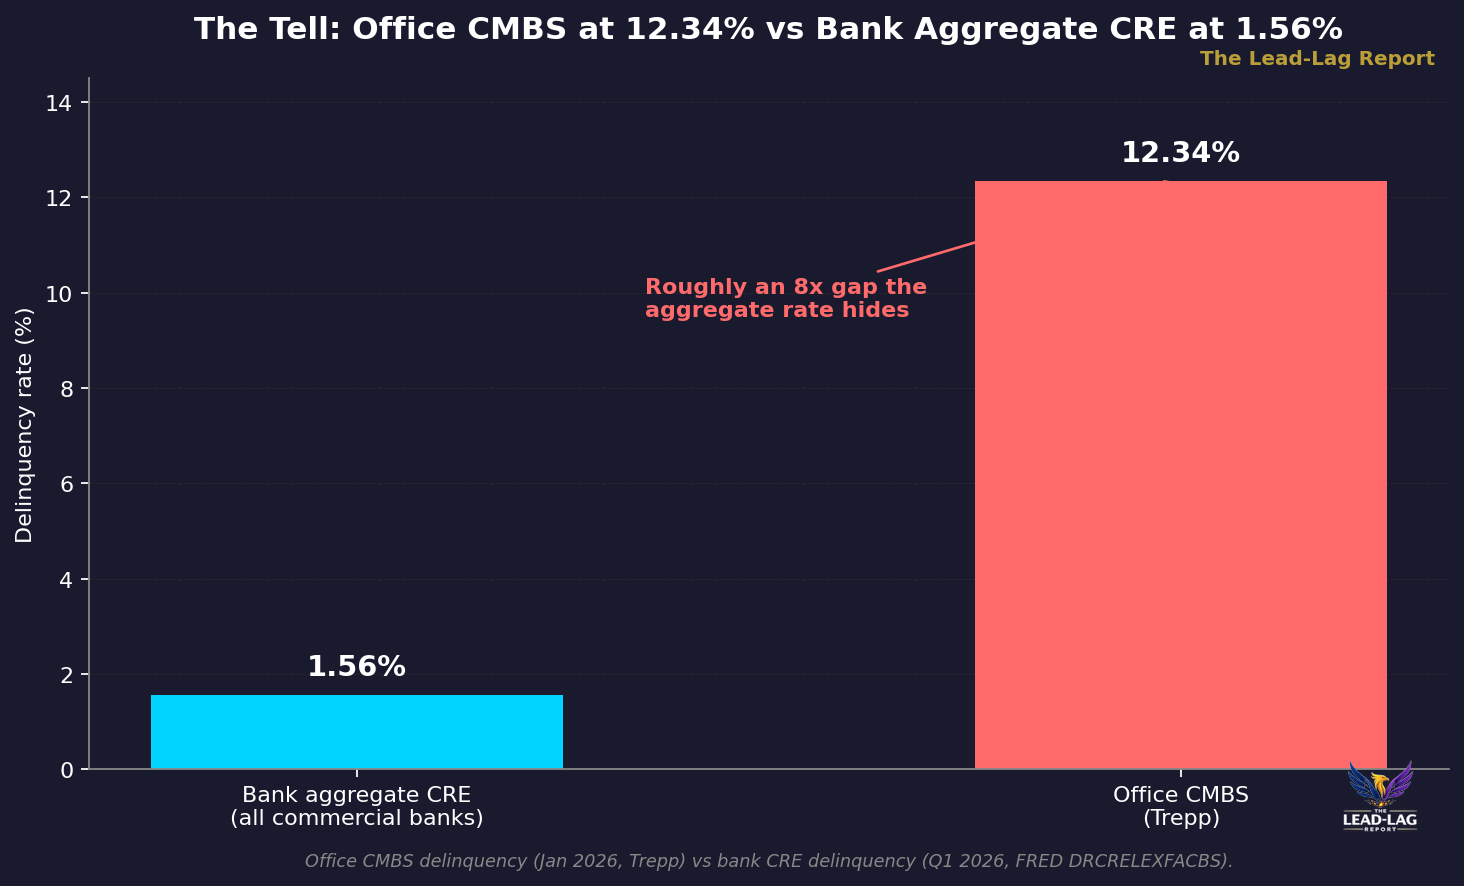
Why the gap. CMBS structures are rigid: a loan that cannot refinance at maturity becomes delinquent, gets flagged, and shows up in the data. A bank loan has an officer, a relationship, and discretion. When a borrower cannot refinance a 2019-vintage office loan at 2026 coupons, the bank can extend the maturity, capitalize interest, or restructure the terms rather than force the default. The loan stays current on paper. The economic loss is deferred, not avoided. This is the difference between how a market prices distress and how a balance sheet reports it.
The Maturity Wall Meets the Coupon Wall
The mechanism that turns deferral into a slow grind is the refinancing math. A large tranche of CRE debt written in the low-rate years is maturing into a market where the take-out coupon is materially higher and the collateral value is, at best, flat. FDIC data for the first quarter of 2026 show loan and lease balances still rising — up $16.1 billion, or 0.8%, quarter over quarter and 5.4% year over year — with the quarterly growth led by nonfarm nonresidential CRE loans.[3] Banks are not shrinking their CRE exposure into the maturity wall. They are adding to it.
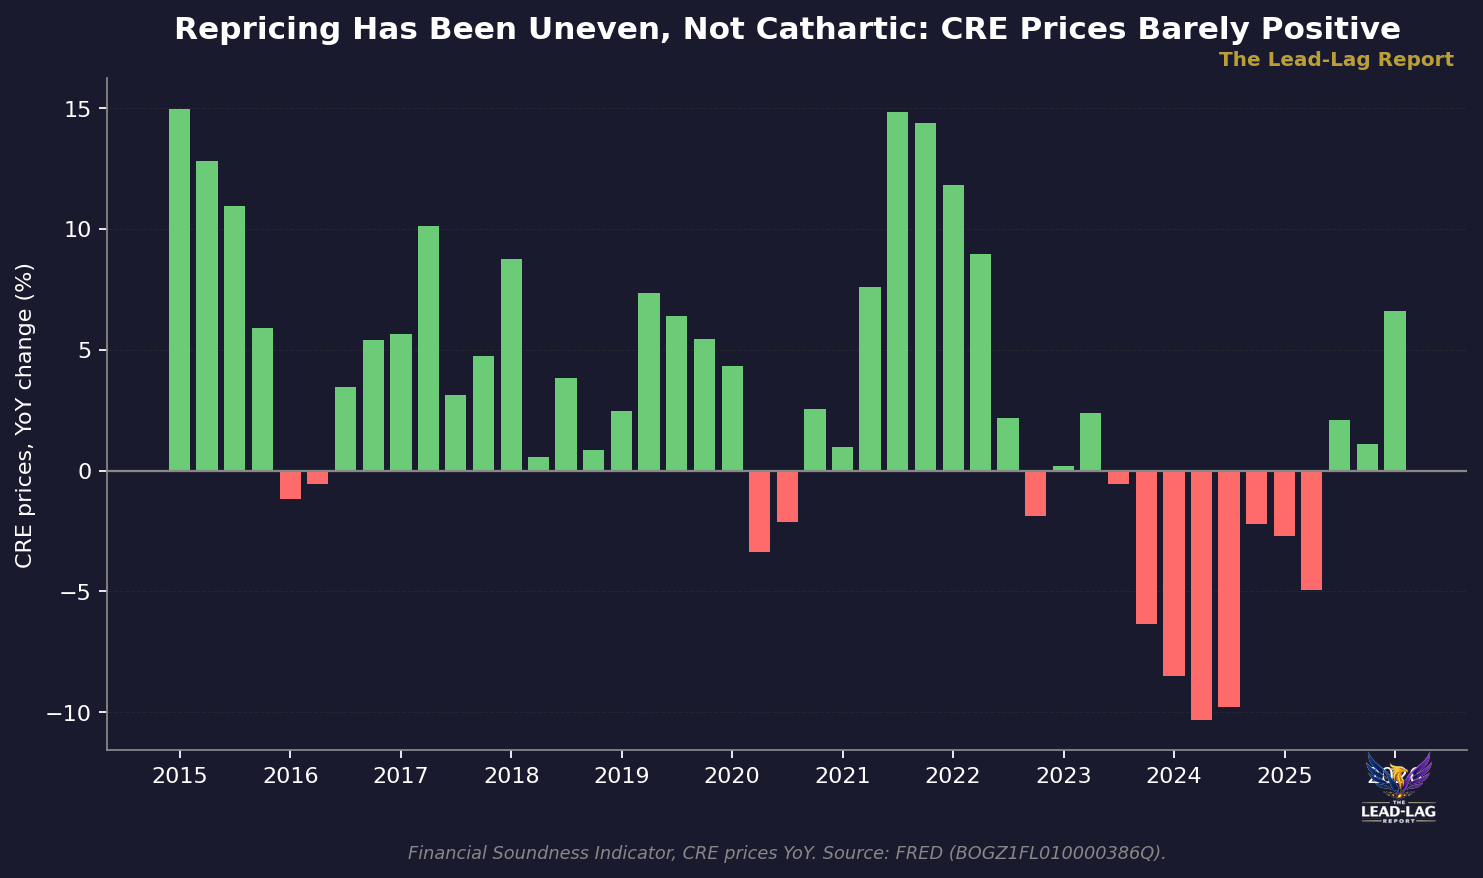
And the collateral is not bailing them out. The Federal Reserve's financial soundness indicator for commercial real estate prices shows the year-over-year change at roughly 0.56% for the fourth quarter of 2025 — essentially flat.[4] A flat price is not a recovery. It means the equity cushion that borrowers put up years ago has not been rebuilt, so a maturing loan refinances against the same impaired value at a higher rate. The debt service coverage ratio compresses, the borrower asks for an extension, and the bank grants it because the alternative is crystallizing the loss.
Each extension buys time but not a cure. The higher coupon on the refinanced portion compresses the borrower's cash flow. The bank, meanwhile, is required to build allowances for credit losses on loans it now judges riskier, even if they remain current. That reserve build is a charge against earnings today. It is capital that leaves the tangible common equity line before a single loan is ever marked delinquent. The delinquency rate can stay at 1.56% while the earnings power and the capital base of the CRE-heavy cohort quietly erode.
The Stress Test Already Told You
If the mechanism sounds speculative, the Federal Reserve has already put a number on the tail. The 2026 supervisory stress test projects $76.5 billion of aggregate domestic commercial real estate loan losses, at an 8.8% portfolio loss rate, over the 2026:Q1 to 2028:Q1 horizon.[5] An 8.8% loss rate is not a 1.56% delinquency rate. The gap between the two is the distance between what the stressed scenario knows is embedded in the book and what the current-period delinquency data are willing to admit.
The same exercise projects $708 billion of aggregate losses across loans and other positions over the nine-quarter horizon.[6] CRE is a meaningful slice of that, and it is concentrated in exactly the institutions the stress test framework covers least completely — the CRE-concentrated regionals and community banks that sit below the largest, most-scrutinized tier. The Fed's own severe scenario is telling you that the loss content is there. The delinquency rate simply has not been forced to recognize it yet.
Meanwhile the aggregate stock of CRE loans on bank balance sheets keeps climbing, reaching about $3,112.66 billion in June 2026.[7] A growing book with a benign delinquency rate and an 8.8% stressed loss rate is precisely the configuration in which losses accumulate quietly. The denominator grows, the numerator is managed, and the reported ratio stays calm while the underlying capital does the bleeding.
The Symptoms Are Already in the Data
You can already see the early edge of the grind in the aggregate bank data, even before it reaches CRE delinquency specifically. The FDIC's first-quarter 2026 Quarterly Banking Profile showed past-due and nonaccrual loans rising 9 basis points to 1.44%, and unrealized losses on securities increasing $2.6 billion, or 8.9%, to $32.2 billion.[8] Rising nonaccruals and a growing unrealized-loss overhang are the ambient conditions in which a CRE-concentrated bank has the least room to absorb a reserve build. The securities book is already eating capital through accumulated other comprehensive income; the CRE book is the next claim on the same thin cushion.
This is why the regime matters more than any single print. A bank does not need a wave of defaults to be impaired. It needs a portfolio that cannot earn its cost of capital, a maturity schedule that forces continuous restructuring, and a supervisor requiring reserves against loans that are technically performing. Put those together and you get an institution whose stock trades at a discount to tangible book, whose net interest margin is structurally pressured, and whose ability to grow out of the problem is capped by the very concentration that created it. None of that shows up in a delinquency rate until it is far too late to be a warning.
For positioning, the implication is about differentiation, not a blanket view on the sector. The exposure that matters is the spread between diversified, deposit-rich institutions and the CRE-concentrated regionals carrying the office and secondary-market maturity wall. The asymmetry sits in that dispersion — in recognizing that the aggregate delinquency rate is a lagging comfort, while the reserve build, the margin compression, and the tangible-capital erosion are the leading tells.
What Would Prove This Wrong
A thesis without a falsification condition is just a narrative, so here is mine, stated precisely.
This thesis is wrong if (a) systemwide CRE delinquency stays flat-to-down while (b) banks' allowance for credit losses and charge-offs on CRE do not rise and (c) bank capital ratios and funding costs do not deteriorate for CRE-concentrated banks during the 2026 maturity wall. Put differently: if maturities refinance cleanly without forcing higher loss recognition or capital strain at the regional-bank cohort, the 'silent loss' mechanism fails.
That is a real test, and it can resolve against me. If coupons fall fast enough that the maturity wall refinances cleanly, if prices recover enough to rebuild the equity cushion, and if the CRE-concentrated regionals report stable reserves and stable capital through the wall, then the grind never materializes and the 1.56% was telling the truth all along. I do not think that is the base case. But the point of naming the condition is to know, in advance, exactly what data would change my mind.
The next leg of the commercial real estate cycle is unlikely to look like 2008 or even like March 2023. It will look like a delinquency rate that stays reassuringly low while earnings, reserves, and tangible capital at the CRE-concentrated cohort grind lower quarter after quarter — a loss recognized everywhere except the one number consensus keeps watching.
Few understand this.
— — —
Notes
[1] FRED, "Delinquency Rate on Commercial Real Estate Loans (Excluding Farmland), All Commercial Banks (DRCRELEXFACBS)." Latest value 1.56% for Q1 2026. https://fred.stlouisfed.org/series/DRCRELEXFACBS
[2] Trepp, "Office CMBS Delinquency Hits an All-Time High — What the Data Is Really Saying." CMBS office delinquency rate reached 12.34% in January 2026, surpassing the 11.76% peak in October 2025. https://www.trepp.com/trepptalk/office-cmbs-delinquency-hits-an-all-time-high-what-the-data-is-really-saying
[3] BerryDunn summary of the FDIC Q1 2026 Quarterly Banking Profile. Loan and lease balances increased $16.1B (0.8%) QoQ and 5.4% YoY, with quarter-over-quarter growth led by nonfarm nonresidential CRE loans. https://www.berrydunn.com/news-detail/fdic-issues-its-first-quarter-2026-quarterly-banking-profile
[4] FRED, Financial Soundness Indicator for commercial real estate prices YoY (BOGZ1FL010000386Q). Q4 2025 YoY change of 0.55685%. https://fred.stlouisfed.org/series/BOGZ1FL010000386Q
[5] Federal Reserve, "2026 Dodd-Frank Act Stress Test Results" (June 2026). Aggregate domestic CRE loan losses of $76.5B at an 8.8% portfolio loss rate over the 2026:Q1–2028:Q1 horizon. https://www.federalreserve.gov/publications/2026-june-dodd-frank-act-stress-test-results.htm
[6] Federal Reserve, "2026 Dodd-Frank Act Stress Test Results" (June 2026). Aggregate losses on loans and other positions of $708B over the nine-quarter projection horizon. https://www.federalreserve.gov/publications/2026-june-dodd-frank-act-stress-test-results.htm
[7] FRED, "Commercial Real Estate Loans, All Commercial Banks (CREACBM027NBOG)." Latest level 3,112.6646 (billions of USD) for Jun 2026. https://fred.stlouisfed.org/series/CREACBM027NBOG
[8] BerryDunn summary of the FDIC Q1 2026 Quarterly Banking Profile. Past-due and nonaccrual loans increased 9 bps to 1.44%; unrealized losses on securities increased $2.6B (8.9%) to $32.2B. https://www.berrydunn.com/news-detail/fdic-issues-its-first-quarter-2026-quarterly-banking-profile
The Lead-Lag Report is provided by Lead-Lag Publishing, LLC. All opinions and views mentioned in this report constitute our judgments as of the date of writing and are subject to change at any time. Information within this material is not intended to be used as a primary basis for investment decisions and should also not be construed as advice meeting the particular investment needs of any individual investor. Trading signals produced by the Lead-Lag Report are independent of other services provided by Lead-Lag Publishing, LLC or its affiliates, and positioning of accounts under their management may differ. Please remember that investing involves risk, including loss of principal, and past performance may not be indicative of future results. Lead-Lag Publishing, LLC, its members, officers, directors and employees expressly disclaim all liability in respect to actions taken based on any or all of the information on this writing.



