
The Sidelines Illusion
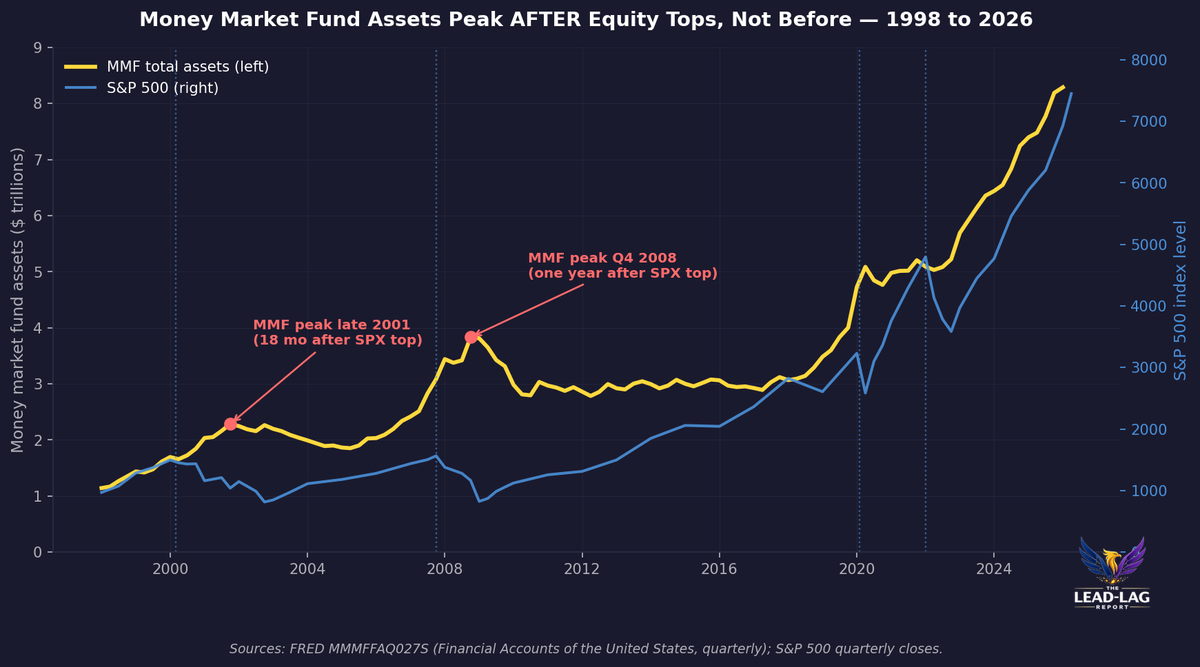
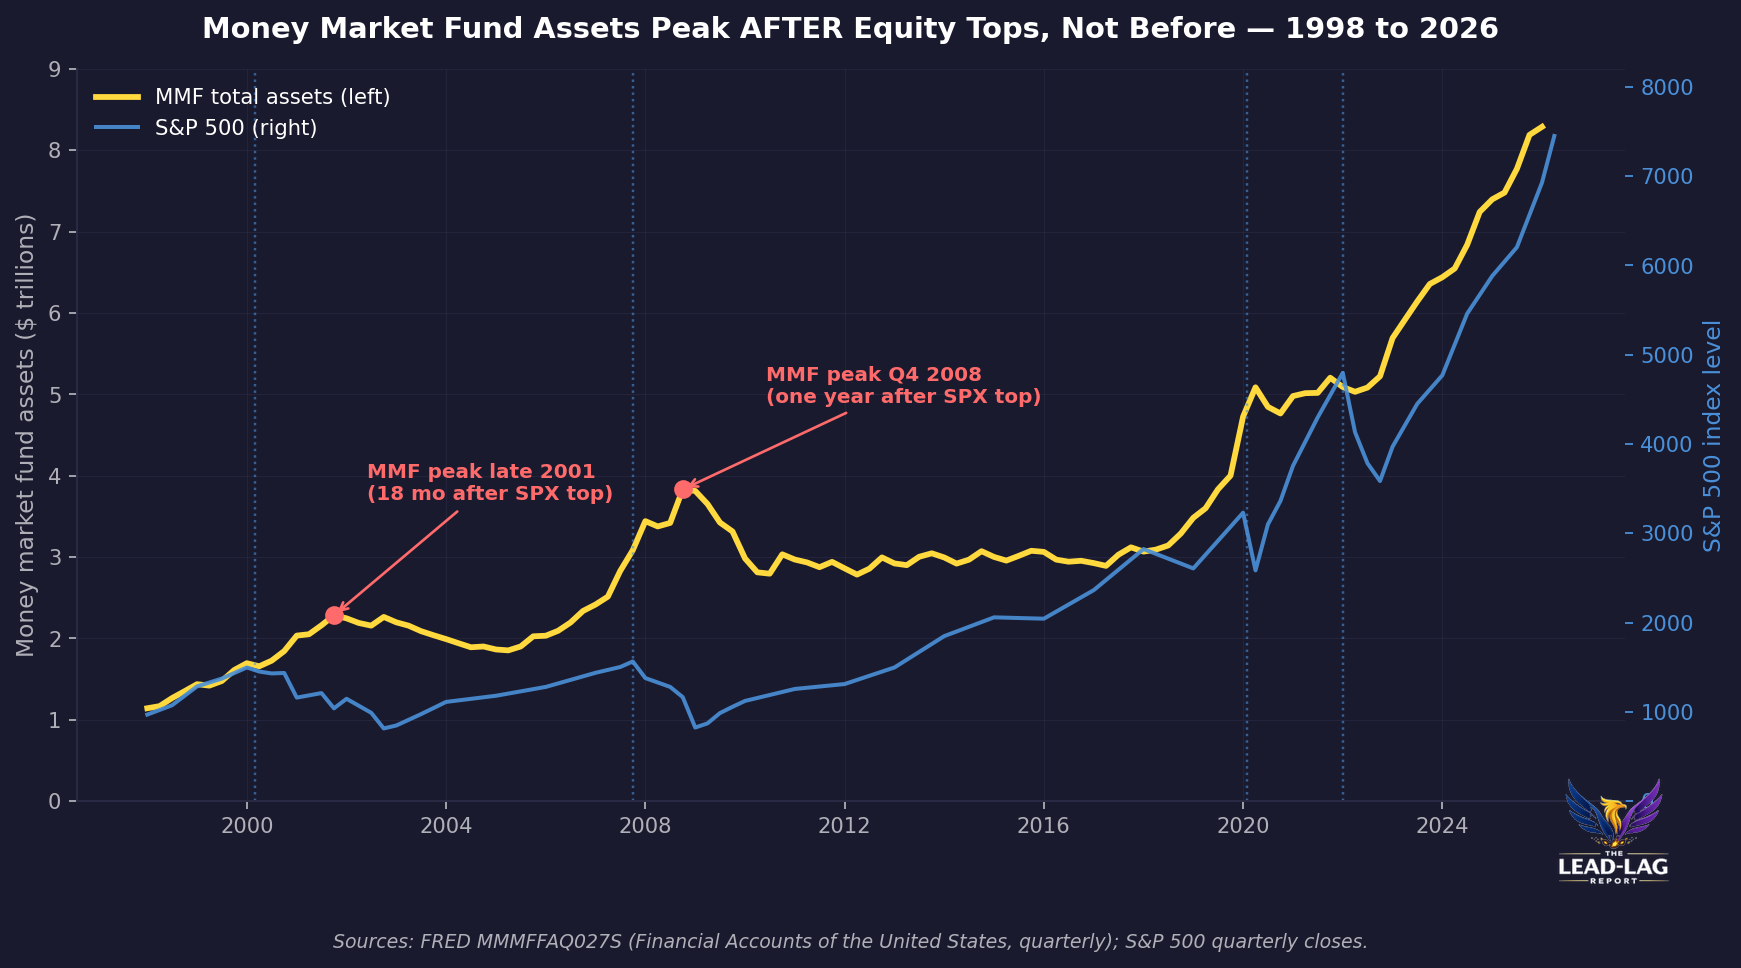
Money market fund balances peak after equity tops, not before. In 2008-2009 they peaked as stocks bottomed. The sidelines narrative reverses the direction of the arrow.

Today’s Lead-Lag Report post is sponsored by workzone

Kill The Busywork. Get Your Week Back.
It’s called vibe coding: you describe what you want in plain English, and AI builds it. Landing pages and campaigns. Dashboards and reports for leadership. Automations that kill the busywork. No code, no waiting on anyone else. On July 30th, we’ll show you how, starting from the beginning.
DISCLAIMER – PLEASE READ: This is sponsored advertising content for which Lead-Lag Publishing, LLC is being paid a fee. The information provided is solely the creation of workzone. Lead-Lag Publishing, LLC does not guarantee the accuracy or completeness of the information provided or make any representation as to its quality. All statements and expressions provided are the sole opinion of workzone and Lead-Lag Publishing, LLC expressly disclaims any responsibility for action taken in connection with the information provided.
The Sidelines Illusion
Why Money Market Fund Balances Peak After Equity Tops, Not Before
Macro Observations is a weekly deep-dive into the exposures the consensus is quietly mispricing. Each installment takes one narrative the market treats as settled and interrogates the structural evidence that says it may not be.
Key Highlights
- Money market fund assets stand at a record 7.89 trillion dollars for the week ended July 15, 2026, having touched an all-time high of 7.95 trillion on July 8. The consensus reads this as cash on the sidelines waiting to buy stocks. The historical record reads it the other way.
- In every major equity cycle of the last quarter century, money market fund balances kept rising after the S&P 500 topped, and in 2008 to 2009 they peaked as equities bottomed. The 'sidelines' framing inverts the actual lead-lag. Cash is a coincident-to-lagging risk indicator, not a coiled spring.
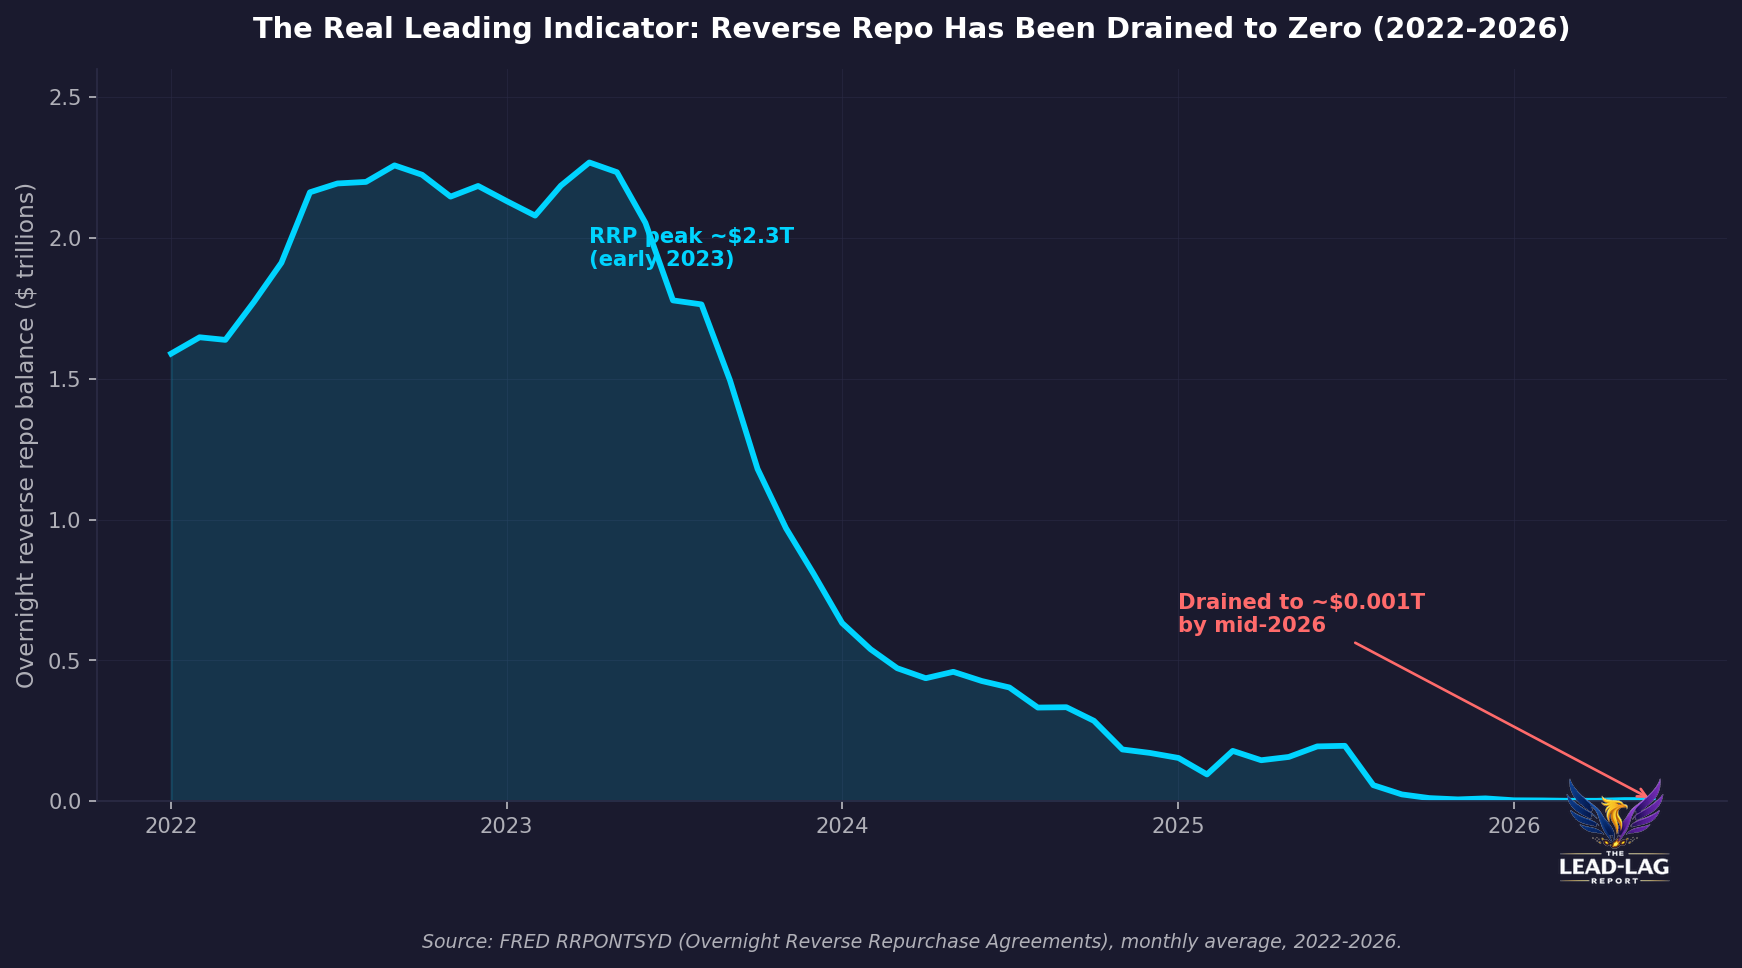
- The overnight reverse repo facility, the pool that actually front-ran the surge in fund balances, has been drained from roughly 2.3 trillion dollars in early 2023 to essentially zero by mid-2026. The marginal cash that could rotate has already moved.
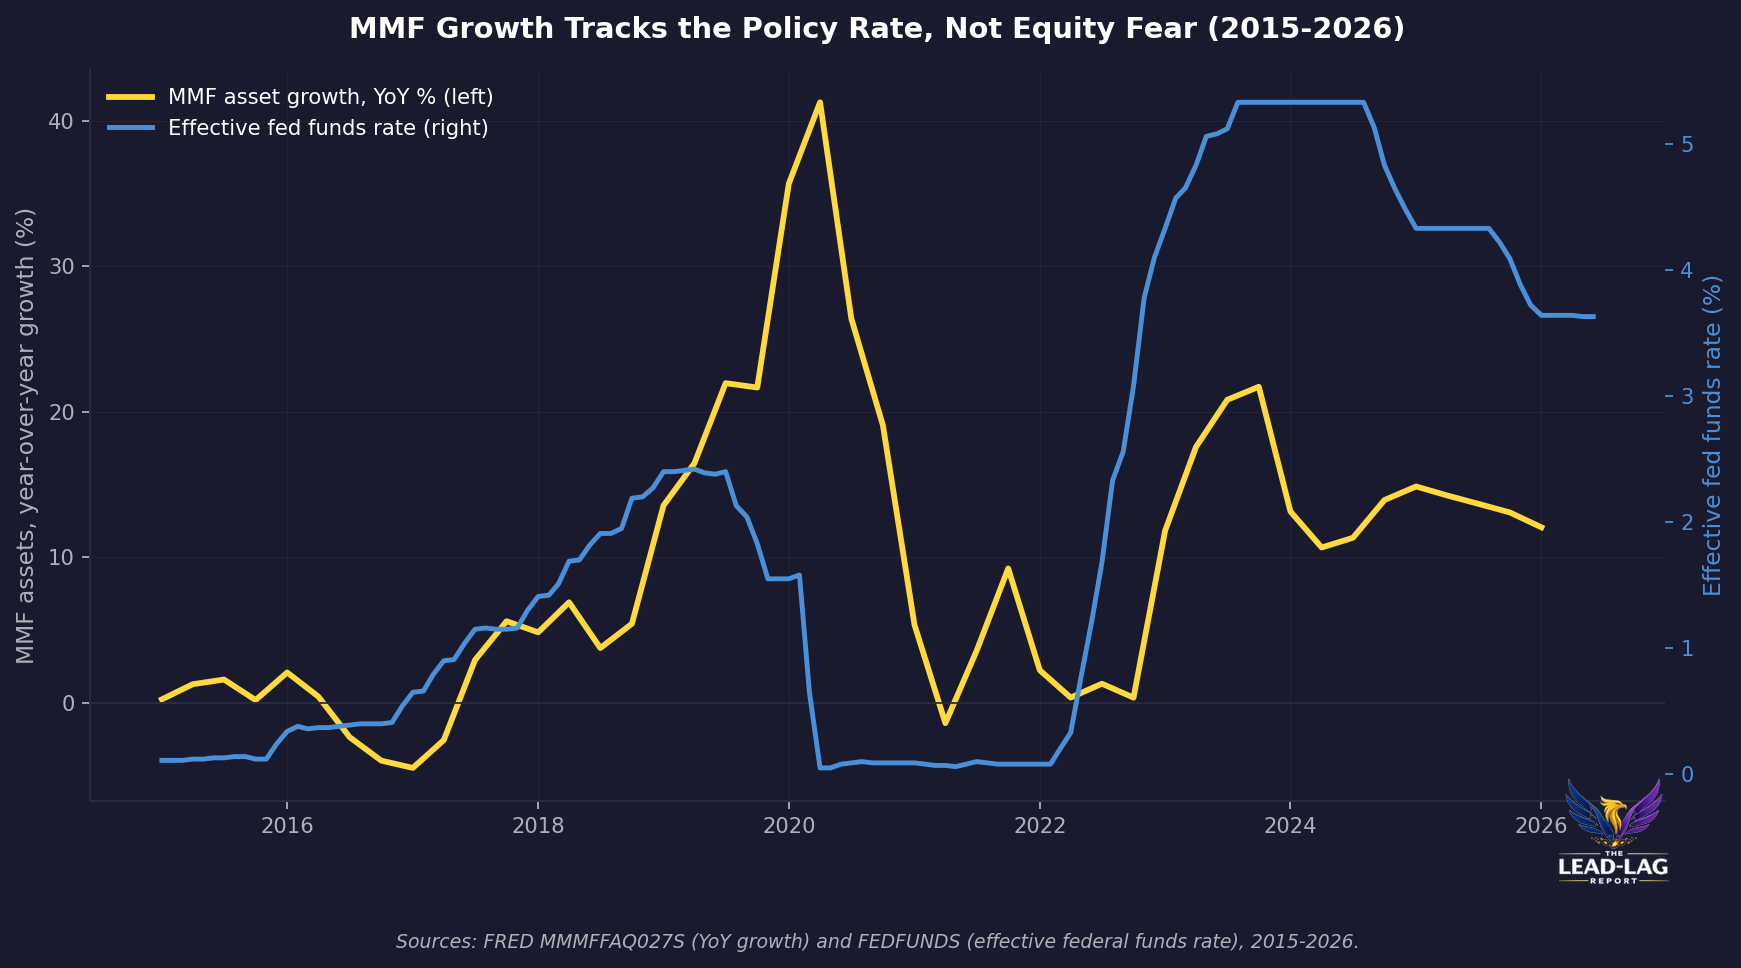
- Money market fund growth tracks the policy rate far more tightly than it tracks equity fear. With effective fed funds at 3.63 percent and front-end yields still near 4 percent, the balances are being paid to sit, not frightened into hiding.
- The thesis has one clean falsifier: a sustained decline in the actual balance, not a one-week flow reversal, occurring alongside equity strength. That combination has not appeared in the modern record. It has not appeared now.
There is a number that gets recited in every strategy note, every television segment, every bullish year-ahead outlook. Nearly eight trillion dollars sits in money market funds. It is described as fuel, as dry powder, as cash on the sidelines waiting for its moment to pour into equities. The framing is so familiar that almost no one stops to check whether the history supports it.
It does not. The record says the opposite. Money market fund balances do not lead equities higher. They peak after equities top, and in the most-cited cycle of the modern era they peaked precisely as stocks bottomed. The sidelines narrative does not merely overstate the case. It reverses the direction of the arrow.
The Consensus Everyone Repeats
Start with what the market believes. The Investment Company Institute reported total money market fund assets of 7.89 trillion dollars for the week ended July 15, 2026, down 59.9 billion from the prior week and just below the record 7.95 trillion set on July 8.[1] A year earlier the figure was 7.07 trillion. The balance has compounded relentlessly, and every increment has been narrated the same way: money is piling up, and when it finally moves, it will move into stocks.
The logic feels intuitive. Cash earns a yield today, but it earns nothing in real terms if inflation grinds on, so surely it must eventually chase returns. That intuition is the entire foundation of the sidelines thesis. It treats the money market balance as potential energy, a spring under tension, coiled and ready. The problem is that potential energy is not what the data describes. To see why, you have to look at what the balance actually did around the last three equity peaks.
What the Balances Actually Did
The S&P 500 topped the dot-com cycle at a closing high near 1,527 on March 24, 2000.[2] Money market fund assets at that point stood near 1.66 trillion dollars. Over the next eighteen months, as the index fell more than forty percent, fund balances did not deploy into the decline. They climbed, reaching roughly 2.29 trillion by late 2001 while stocks were still falling.[3] The cash did not rush in to catch the bottom. It accumulated on the way down.
The next cycle is even cleaner. The S&P 500 set its pre-crisis record close of 1,565.15 on October 9, 2007.[4] Money market fund assets were about 3.09 trillion dollars. As the financial crisis unfolded, balances kept rising, reaching roughly 3.83 trillion in the fourth quarter of 2008 and holding near 3.81 trillion into the first quarter of 2009.[3] The equity market bottomed on March 9, 2009 at a closing low of 676.53.[4] In other words, the money market balance peaked at almost the exact moment equities bottomed. This is the single most misread data point of that entire cycle.
Anyone who watched the 3.8 trillion dollar pile in early 2009 and concluded it was fuel waiting to lift stocks had the causality backwards. The cash was not a leading indicator of a rally. It was the fingerprint of the fear that had already driven the selling. As confidence returned through 2009 and 2010, balances fell, dropping below 2.8 trillion by mid-2010 even as the S&P 500 nearly doubled off the low. The money did not flood in at the bottom. It leaked out slowly as the recovery aged.
The 2020 episode compressed the same pattern into weeks. The S&P 500 peaked at 3,386.15 on February 19, 2020.[4] Money market balances then surged from roughly 3.6 trillion to more than 5 trillion dollars in a single quarter as the pandemic panic hit, cresting in the second quarter of 2020 while equities were near their crash low of March 23.[3] Again the balance topped as the market bottomed, then drifted lower as stocks recovered. Three cycles, one direction. Cash builds into and through equity declines and tops out at the point of maximum fear, not the point of maximum opportunity.
The Mechanism, Stated Plainly
The reason is not mysterious once the accounting is respected. Money does not sit in a money market fund waiting to feel brave. It arrives there when investors sell risk and moves out when they buy it. When equities top and roll over, risk-off flows move into money funds, which is exactly why the balance rises as stocks fall. The 'cash on the sidelines' is therefore a lagging measure of risk aversion, a record of selling that already happened, not a forecast of buying about to happen.
There is a second, more current mechanism at work, and it has nothing to do with fear. Cash is being paid to stay cash. With the effective federal funds rate at 3.63 percent in June 2026 and front-end government money fund yields still near four percent, the balance is a rational yield allocation, not a fear allocation.[5] That is why money market growth has tracked the policy rate far more faithfully than it has tracked any equity fear gauge. The 2022 to 2024 build coincided with the sharpest hiking cycle in forty years, not with an equity panic. Investors were not hiding. They were collecting.
This distinction matters because it kills the deployment story on its own terms. If balances are high because cash is well paid, then the trigger for an exodus is falling yields, which means rate cuts, which historically arrive when the economy is weakening. The scenario that supposedly unleashes the sidelines into equities is the same scenario that usually accompanies falling equities. The spring, if it releases, tends to release into a downturn.
The Signal That Actually Led
If you want a genuine leading indicator of money market flow direction, ignore the headline balance and watch the plumbing. The Federal Reserve's overnight reverse repo facility absorbed the excess cash that money funds could not place elsewhere during the 2021 to 2023 liquidity glut, peaking near 2.3 trillion dollars in early 2023.[6] As bill supply surged and the facility's relative yield faded, that balance drained steadily, falling to roughly one billion dollars by mid-July 2026, effectively zero.[6] That drawdown, not the sidelines narrative, funded a large share of the money fund growth of the last two years.
The implication is uncomfortable for the bulls who lean on the cash pile. The marginal reservoir that could feed still-higher balances has already been emptied. And the balance itself keeps rising alongside equities rather than rotating into them, which is precisely what the historical pattern predicts when both cash yields and equity prices are attractive at once.
What This Changes About Positioning
None of this argues that equities must fall. It argues that the most popular reason given for why they must rise is empirically backwards. Treating 7.9 trillion dollars of money fund assets as a bullish setup confuses a coincident risk gauge for a forward catalyst. The exposure question is not whether the sidelines will deploy. It is whether investors are underwriting equity risk on the strength of a signal that has historically fired at tops and bottoms in the wrong direction.
The asymmetry runs the other way. If the balance is a fear-and-yield gauge rather than a buying reserve, then the moment it finally contracts in earnest is more likely to coincide with the yield decline of an easing cycle, and easing cycles have a long history of overlapping with equity weakness rather than equity melt-ups. Positioning built on the sidelines thesis is therefore long a narrative that, on the record, tends to resolve against it precisely when it is invoked most confidently.
What Would Prove Me Wrong
A thesis without a falsifier is a slogan, so here is the clean one. If total money market fund assets post a sustained decline, an actual multi-month drop in the balance itself and not a single-week flow reversal, at the same time equities are making new highs, the inversion argument fails. That combination would show cash genuinely rotating out of funds and into risk while stocks rise, which is the mechanism the sidelines crowd asserts. It has not happened in the 2000, 2008, or 2020 cycles, and it is not happening in 2026, where balances and the S&P 500 have risen together.[1] Watch the balance, not the story. The balance will tell you which regime you are actually in.
Until that print arrives, the honest reading of nearly eight trillion dollars in money funds is not that a wave of buying is coming. It is that investors are being paid handsomely to wait, that the reservoir which fed the pile is empty, and that the last three times this cash pile looked its largest, the opportunity had already passed rather than arrived.
Few understand this.
Notes
[1] Investment Company Institute, weekly 'Money Market Fund Assets' release, July 16, 2026. https://www.ici.org/research/stats/mmf. Total money market fund assets 7,893.17 billion dollars for the week ended July 15, 2026, down 59.90 billion week over week; prior week 7,953.06 billion (July 8, 2026 record); 7,947.83 billion on July 1, 2026. Government 6,510.91 billion; prime 1,236.42 billion; tax-exempt 145.85 billion. Retail 3,084.31 billion; institutional 4,808.86 billion. One year earlier (July 2025): approximately 7.07 trillion per ICI weekly series.
[2] Wikipedia, 'Closing milestones of the S&P 500,' citing the March 24, 2000 dot-com peak (intraday high 1,552.87; closing high near 1,527). https://en.wikipedia.org/wiki/Closing_milestones_of_the_S%26P_500. Cross-referenced with FRED series SP500 daily closes.
[3] Federal Reserve Board, Financial Accounts of the United States, money market funds total financial assets, FRED series MMMFFAQ027S (quarterly, millions of dollars). https://fred.stlouisfed.org/series/MMMFFAQ027S. Q1 2000: 1,696,149 million. Q4 2001: 2,285,310 million. Q4 2007: 3,085,760 million. Q1 2008: 3,442,540 million. Q4 2008: 3,832,237 million. Q1 2009: 3,813,876 million. Q2 2010: 2,796,581 million. Q1 2020: 4,727,179 million. Q2 2020: 5,087,590 million. Q1 2026: 8,289,569 million. (The Financial Accounts measure runs above the ICI weekly retail-plus-institutional series because of differing coverage.)
[4] S&P 500 cycle turning points. October 9, 2007 closing record 1,565.15; March 9, 2009 closing low 676.53; February 19, 2020 closing peak 3,386.15; March 23, 2020 closing low 2,237.40; January 3, 2022 closing high 4,796.56. Sources: Wikipedia 'Closing milestones of the S&P 500' (https://en.wikipedia.org/wiki/Closing_milestones_of_the_S%26P_500) and ETF Database, 'S&P 500 Snapshot' (https://etfdb.com/innovative-etfs-channel/s-p-500-snapshot-highest-close-year/).
[5] Federal Reserve, effective federal funds rate, FRED series FEDFUNDS (monthly). https://fred.stlouisfed.org/series/FEDFUNDS. June 2026: 3.63 percent, down from 4.33 percent through mid-2025. Front-end government money fund yields near 4 percent per ICI and Crane Data commentary, July 2026.
[6] Federal Reserve Bank of New York / Federal Reserve Board, Overnight Reverse Repurchase Agreements outstanding, FRED series RRPONTSYD (billions of dollars). https://fred.stlouisfed.org/series/RRPONTSYD. Monthly-average balance near 2,268 billion in April 2023, declining to roughly 1.5 billion in March 2026 and near 0.9 billion (approximately zero) by the week ended July 23, 2026.
[7] Reuters, 'US money market funds turn defensive with Fed rate outlook uncertain,' July 15, 2026. https://www.reuters.com/business/us-money-market-funds-turn-defensive-with-fed-rate-outlook-uncertain-2026-07-15/. Assets climbed to a record of nearly 8 trillion dollars in the first week of July 2026 per ICI data. Crane Data's broader Money Fund Intelligence series reported an all-time high near 8.40 trillion on July 6, 2026, illustrating measurement differences across providers.
[8] Investment Company Institute, 'Worldwide Regulated Open-End Fund Assets and Flows, First Quarter 2026.' https://www.ici.org/statistical-report/ww_q1_26. Global money market fund assets rose 1.4 percent to 13.47 trillion dollars in Q1 2026, with a first-quarter inflow of 193 billion dollars following a fourth-quarter 2025 inflow of 467 billion, context for the scale and pace of cash accumulation.
The Lead-Lag Report is provided by Lead-Lag Publishing, LLC. All opinions and views mentioned in this report constitute our judgments as of the date of writing and are subject to change at any time. Information within this material is not intended to be used as a primary basis for investment decisions and should also not be construed as advice meeting the particular investment needs of any individual investor. Trading signals produced by the Lead-Lag Report are independent of other services provided by Lead-Lag Publishing, LLC or its affiliates, and positioning of accounts under their management may differ. Please remember that investing involves risk, including loss of principal, and past performance may not be indicative of future results. Lead-Lag Publishing, LLC, its members, officers, directors and employees expressly disclaim all liability in respect to actions taken based on any or all of the information on this writing.



