
The Independence Illusion
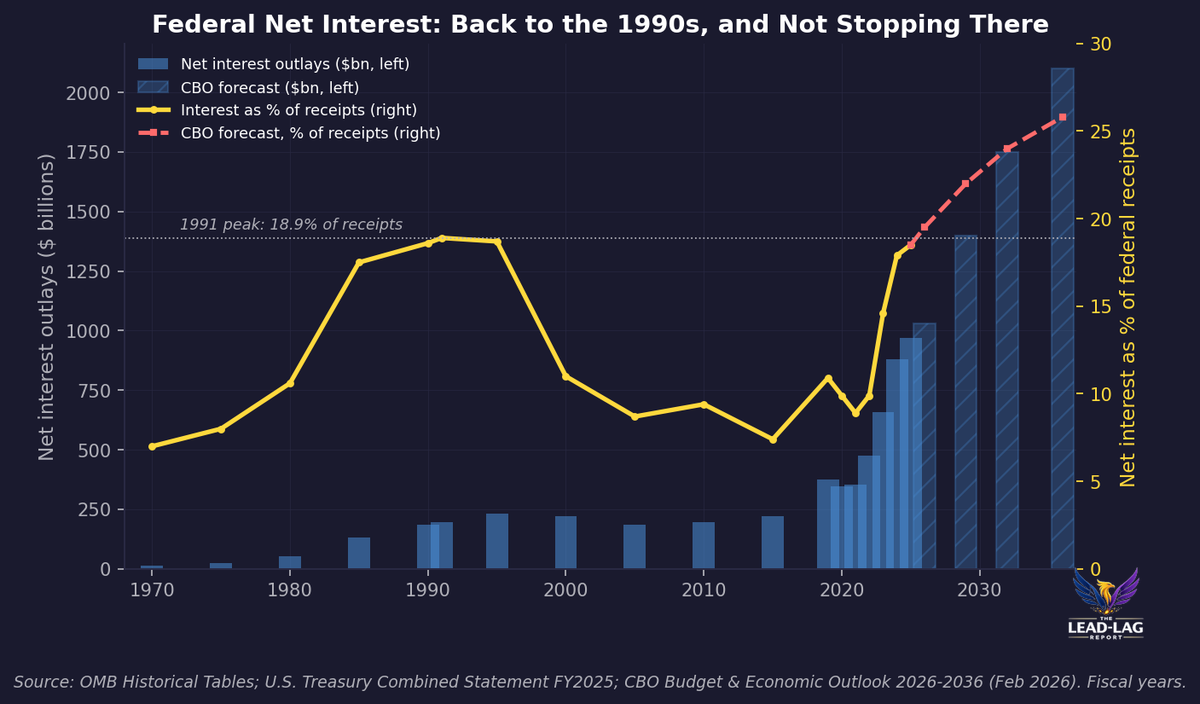
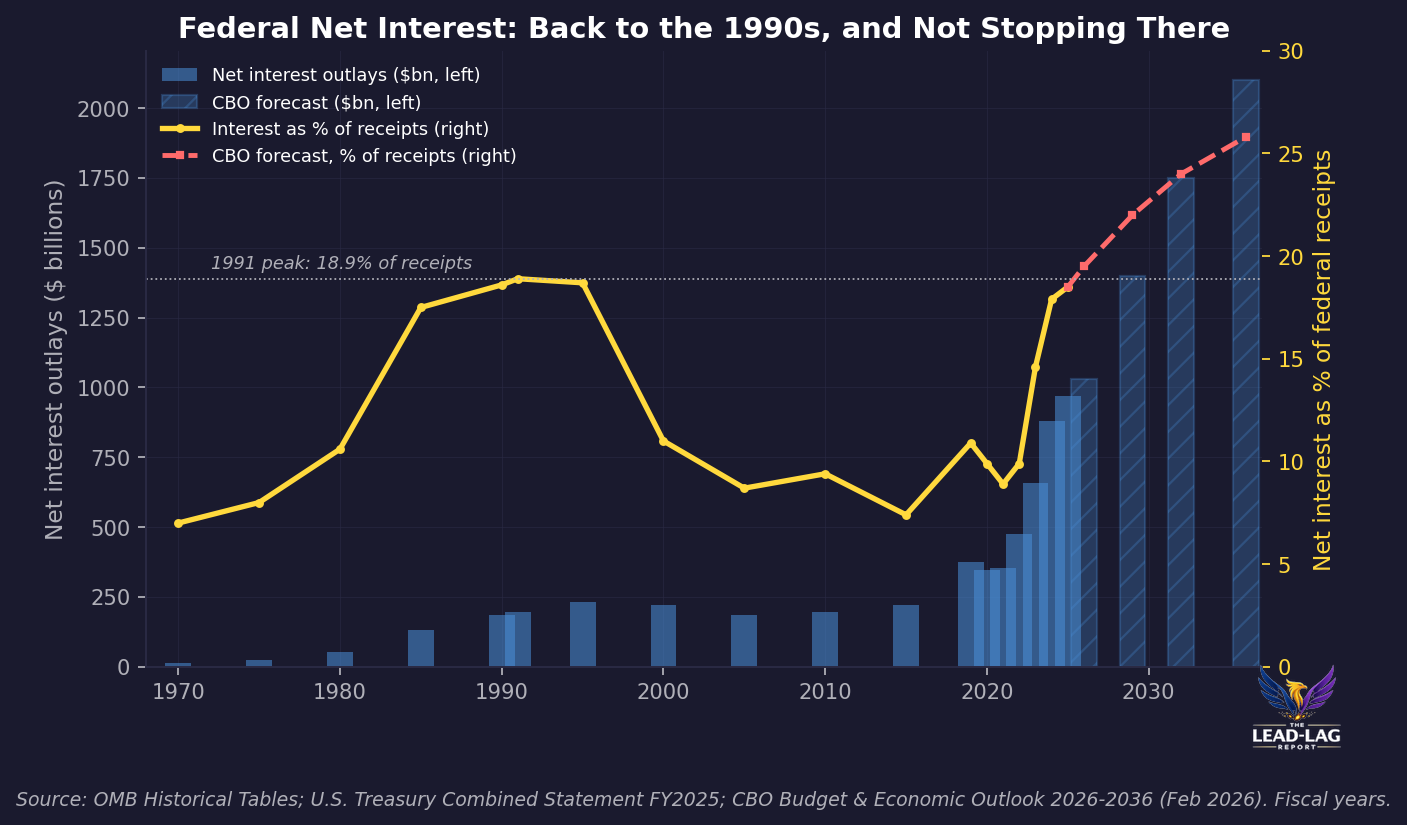
Federal net interest hit $970 billion in fiscal 2025 — 18.5% of federal receipts, the highest share since the data begins in 1940 and above the 1991 peak.

Today’s Lead-Lag Report post is sponsored by Rivo

Rivo Puts The Cash In Your Bank Account To Work Automatically.
You have money sitting in your bank account that could be earning. But moving it around is a hassle. Rivo automatically moves the cash you are not using into U.S. government-backed assets and brings it back before your bills are due. Set it up once, and let Rivo do the work.
DISCLAIMER – PLEASE READ: This is sponsored advertising content for which Lead-Lag Publishing, LLC is being paid a fee. The information provided is solely the creation of Rivo. Lead-Lag Publishing, LLC does not guarantee the accuracy or completeness of the information provided or make any representation as to its quality. All statements and expressions provided are the sole opinion of Rivo and Lead-Lag Publishing, LLC expressly disclaims any responsibility for action taken in connection with the information provided.
The Independence Illusion
When Fed cuts become debt-service necessity
Key Highlights
- Federal net interest hit $970 billion in fiscal 2025 — 18.5% of federal receipts, the highest share since the data begins in 1940 and above the 1991 peak.
- The CBO's own baseline carries net interest to roughly 4.6% of GDP and nearly 26% of receipts by 2036, and does so under benign rate assumptions.
- At 125% of GDP and rising, the United States is closing on the debt profile that turned Japan's central bank into a manager of the government's balance sheet.
- The tell is not the dot plot. It is a firm long yield, a soft dollar, and gold pressing record ground against equities — the market pricing a Fed that cuts because the Treasury needs it to.
The consensus holds that the Federal Reserve is independent and data-driven. That it will cut when the labor market softens or inflation cools, and hold when it does not, guided by a dual mandate and nothing else. This is the story every macro desk tells itself, and it is comforting because it implies the central bank is still the free variable in the system.
It is also becoming an illusion. Not because anyone at the Fed has been captured in the crude sense, but because the arithmetic of the federal balance sheet has grown large enough to bend the reaction function without anyone voting for it. When the interest bill on the national debt becomes one of the largest lines in the budget, the distinction between a growth cut and a debt-service cut stops being clean. The market has started to figure this out. The consensus has not.
The number that changed the argument
In fiscal year 2025, the federal government spent $970 billion servicing its debt.[1] That is not a projection. It is the Treasury's own Combined Statement. Net interest was 18.5% of all federal receipts — for every dollar of taxes and fees collected, roughly nineteen cents went straight to bondholders before a single other obligation was met.[2] That share is the highest since the series began in 1940, and it edges past the prior record set in 1991.[3]
Measured against the economy, net interest reached about 3.2% of GDP in 2025, matching and then eclipsing the 1991 high.[4] In dollar terms, interest is now the second-largest line in the budget behind Social Security, and in fiscal 2024 it surpassed total national defense spending for the first time since at least 1940.[5] A country that spends more servicing its debt than defending itself has crossed a threshold that used to belong to case studies, not to the issuer of the world's reserve currency.
None of this is a forecast in dispute. The numbers are published, audited, and reconciled to the penny. What is in dispute is what they mean for policy, and that is where the consensus is asleep.
The trajectory is the tell
The Congressional Budget Office is not a bearish shop. Its baseline assumes no recession, no crisis, and a gently normalizing rate path. Even so, its February 2026 outlook carries net interest from roughly 3.3% of GDP this year to 4.6% by 2036, at which point debt service alone would consume nearly one-fifth of all federal spending.[6] As a share of receipts, interest climbs toward 26% by the mid-2030s.[7] The dollar figure roughly doubles, from about $1.0 trillion in 2026 to some $2.1 trillion in 2036.[8]
Read that path back into the reaction function. Every basis point on the front end of the curve now compounds against nine trillion dollars of debt rolling over the next two years. A Fed that holds rates high is not merely restraining demand — it is enlarging the single fastest-growing line in the federal budget. That is a cost no prior Fed had to weigh at this scale, and it is the mechanism by which fiscal reality begins to price its way into monetary choices.
The regime, not the accident
This is not the first time debt service has shaped monetary policy, which is precisely why it should be taken seriously rather than dismissed as novel. From 1942 to 1951, the Fed explicitly capped Treasury yields to hold down the government's wartime borrowing cost, subordinating monetary policy to the debt until the 1951 Treasury-Fed Accord restored independence.[9] The 1970s delivered a softer version: a decade in which inflation ran hot, real rates were repeatedly allowed to sit negative, and the debt was quietly inflated down while gold ran from $35 to over $800.[10]
The cleanest modern template is Japan. Government debt crossed roughly 130% of GDP in the late 1990s and never came back; it sits above 230% today.[11] Past that point the Bank of Japan's independence became largely rhetorical. Yield-curve control was not framed as debt management, but that is what it functioned as: the central bank became the buyer that kept the government solvent at rates the budget could bear. The United States, at about 125% of GDP and climbing, is walking into the same corridor from the other end.[12]
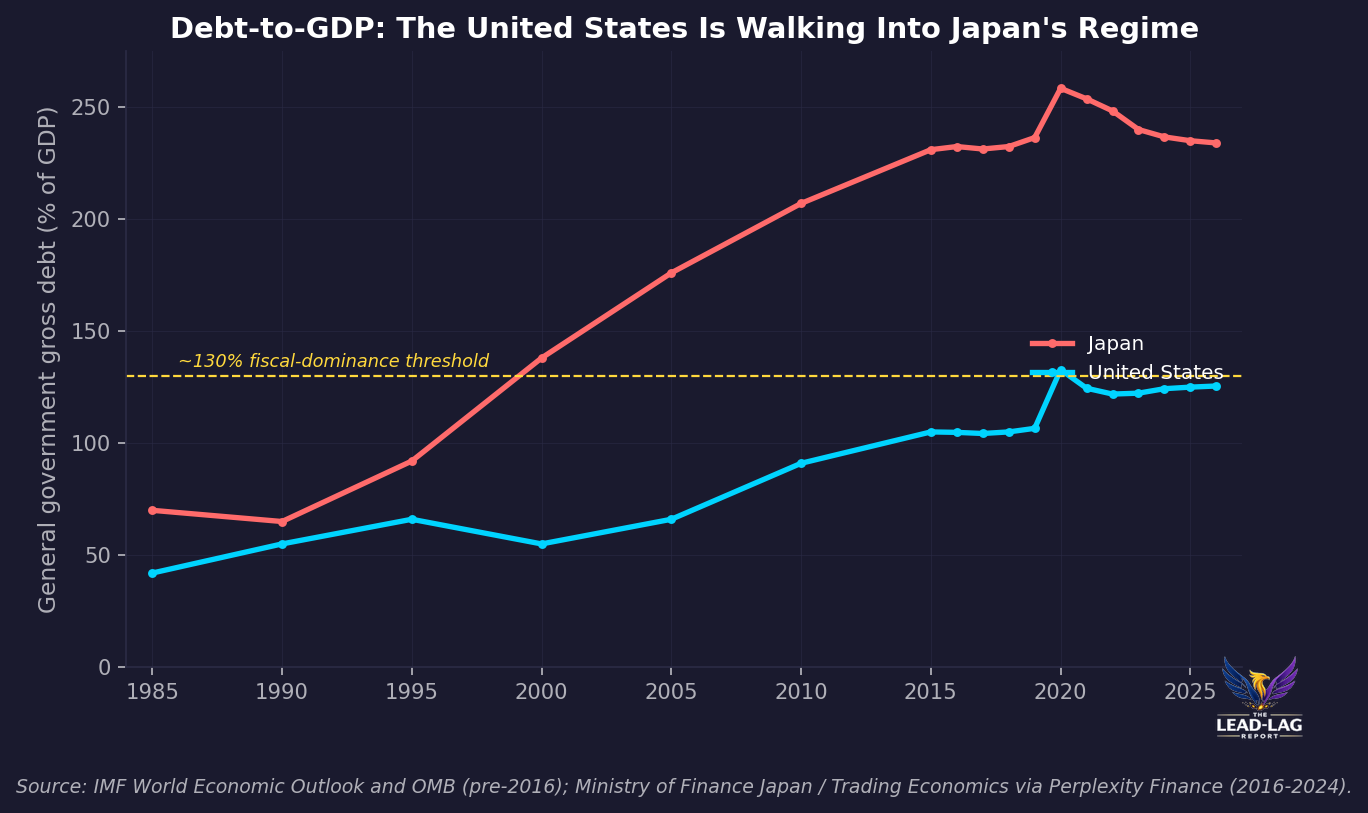
The threshold matters because it is nonlinear. Below roughly 130% of GDP, a debt stock is a headwind. Above it, with a large primary deficit and a rising average coupon, the interest bill starts to feed on itself — higher rates raise the deficit, the larger deficit raises issuance, and issuance pressures rates again. At that point a rate cut stops being purely a growth decision. It becomes, at the margin, a debt-service decision dressed in the language of the mandate.
What the market is already pricing
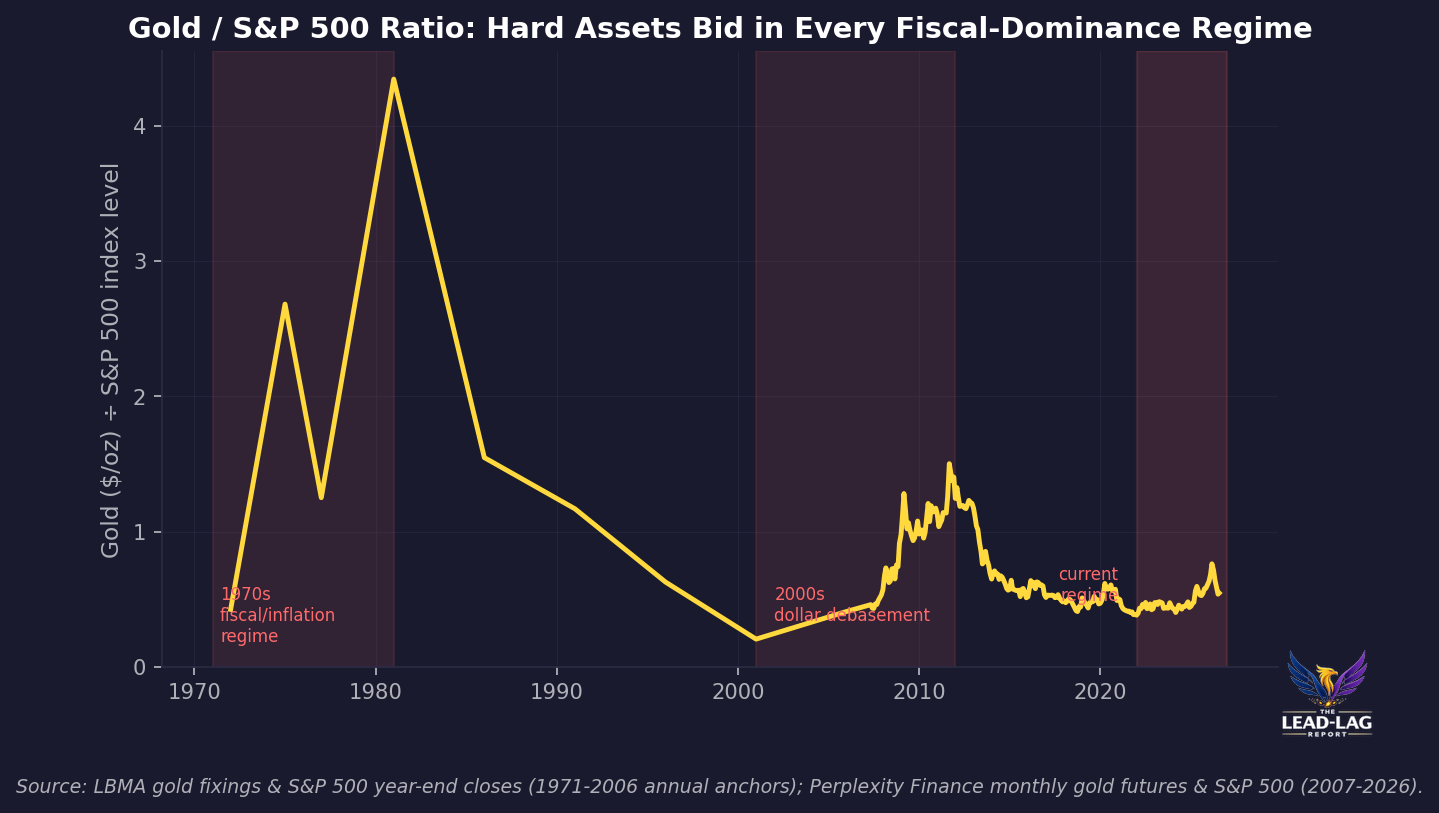
If fiscal dominance were only a thesis, the price tape would ignore it. It is not ignoring it. Gold has pressed record ground against the S&P 500 in the moves that matter, and the gold-to-equity ratio has historically risen in exactly the regimes where the currency's purchasing power is being managed lower to accommodate the debt — the 1970s, the 2000s, and now.[13]
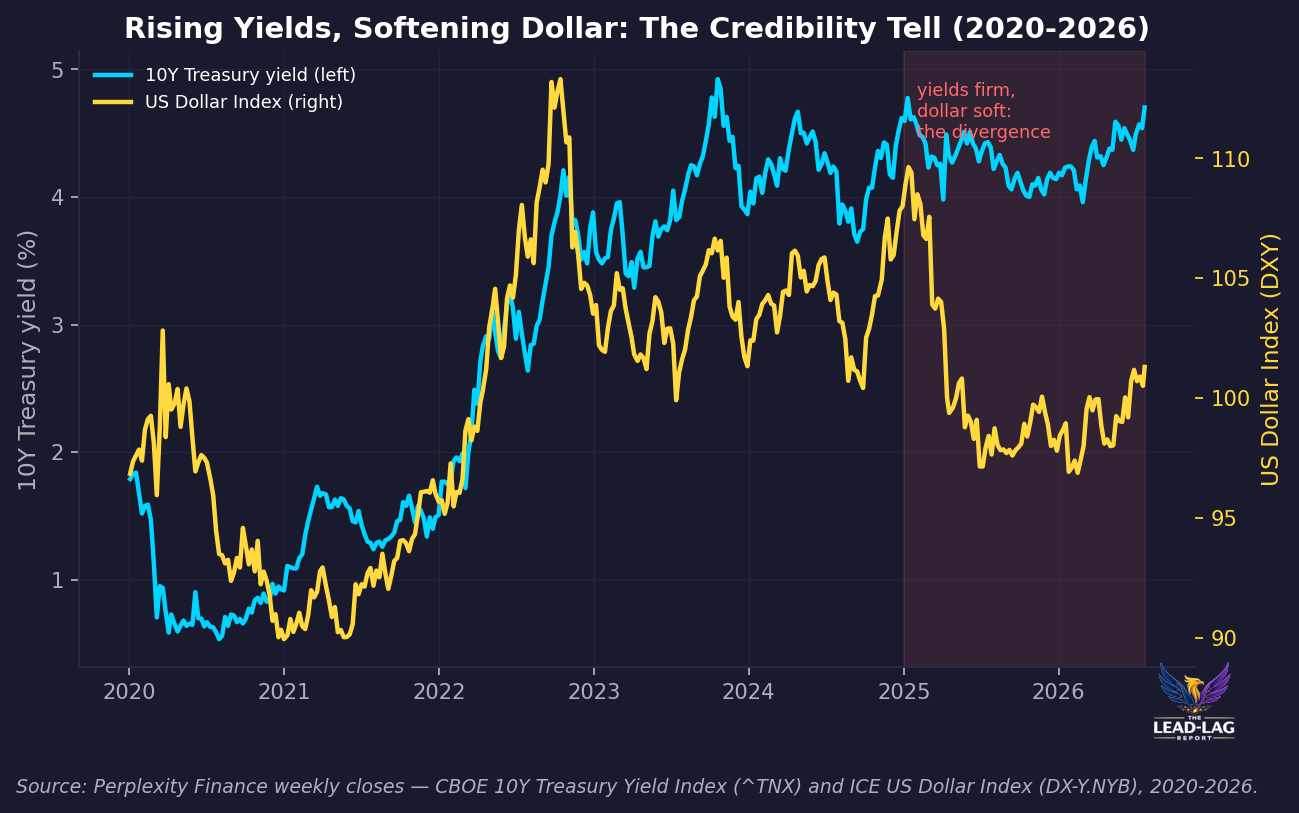
The subtler signal is the relationship between the long yield and the dollar. In an orthodox, credible-central-bank world, higher long yields pull the currency higher. Through 2025 and into 2026 the opposite kept happening: the 10-year yield firmed toward 4.7% while the dollar index drifted lower.[14] That divergence is what fiscal dominance looks like in market data. It says buyers require more yield to hold duration and less confidence to hold the currency — a term-premium story and a credibility story at the same time.
This is why the implications run toward the real-asset regime rather than any single trade. Duration risk is asymmetric here: the entity setting the price of money has a growing structural interest in a lower real cost of that money, and the falsification bar for that view is high. Gold exposure, real assets, and a wary stance on long-duration Treasuries are the natural expressions of a world where the Fed's freedom to stay restrictive is quietly shrinking. None of that is a recommendation to transact — it is a description of where the asymmetry sits.
What would prove this wrong
A thesis that cannot be killed is not analysis, it is faith. This one has a clear falsifier. If the 10-year real yield were to rise and hold above roughly 2.5% while the dollar stayed firm and gold failed to break higher, the fiscal-dominance read would be wrong.[15] That combination — high real rates, strong currency, no hard-asset bid — would say the market still trusts the Fed to keep policy tight regardless of the interest bill, and that debt service is not bending the reaction function after all. Watch those three together, not any one alone.
Until that print arrives, the weight of the evidence points the other way. The interest line is back at 1990s highs and headed higher on the government's own numbers, the debt ratio is entering Japan's regime, and the price of gold and the behavior of the dollar are already voting.
The Fed will keep telling you it is independent and data-driven, and it will keep believing it. But when debt service is the fastest-growing line in the budget, the data the Fed responds to increasingly includes the Treasury's, and a cut delivered for that reason spends exactly like a growth cut — right up until the currency notices the difference.
Few understand this.
— — —
Notes
[1] U.S. Department of the Treasury, Combined Statement of Receipts, Outlays, and Balances, Fiscal Year 2025 — net interest outlays of $970.4 billion. https://fiscal.treasury.gov/reports-statements/combined-statement/
[2] Peter G. Peterson Foundation, Interest Costs on the National Debt, updated July 2, 2026 — interest at 18.5% of federal revenues in FY2025. https://www.pgpf.org/programs-and-projects/fiscal-policy/monthly-interest-tracker-national-debt/
[3] Econofact, “Did interest payments on the federal debt represent a record share of revenue in FY2025?” June 9, 2026 — 18.5% of revenue, a record since the series began in 1940. https://econofact.org/factbrief/fact-check-did-interest-payments-on-the-federal-debt-represent-a-record-share-of-revenue-in-fy2025
[4] Congressional Budget Office, Federal Budget Infographics, March 30, 2026 — net interest 3.2% of GDP in 2025, more than twice the 2021 level. https://www.cbo.gov/publication/62286 Cf. FRED series FYOIGDA188S (interest as % of GDP), 3.15% for 2025. https://fred.stlouisfed.org/series/FYOIGDA188S
[5] U.S. Congress Joint Economic Committee, 2025 Joint Economic Report, Chapter 3 — net interest surpassed national defense outlays in FY2024 for the first time since at least 1940. https://www.jec.senate.gov/public/vendor/_accounts/JEC-R/jer-chapters/2025JERChapter3.pdf
[6] Congressional Budget Office, The Budget and Economic Outlook: 2026 to 2036, February 11, 2026 — net interest rising from 3.3% of GDP to 4.6% by 2036, nearly one-fifth of all federal spending. https://www.cbo.gov/publication/62105
[7] Peter G. Peterson Foundation, Interest Costs on the National Debt — interest reaching 25.8% of federal revenues by 2036 under CBO projections. https://www.pgpf.org/programs-and-projects/fiscal-policy/monthly-interest-tracker-national-debt/
[8] Cato Institute, “CBO Warns of Ballooning Deficits in Latest Fiscal Report,” February 12, 2026 — net interest doubling from $970 billion in 2025 to $2.1 trillion in 2036. https://www.cato.org/blog/cbo-warns-ballooning-deficits-latest-fiscal-report
[9] Federal Reserve History, “The Treasury-Fed Accord” — 1942-1951 wartime yield pegging and the 1951 Accord restoring monetary independence. https://www.federalreservehistory.org/essays/treasury-fed-accord
[10] World Gold Council / historical LBMA fixings — gold rose from the $35 official price after 1971 to above $800 by January 1980 amid negative real rates. https://www.gold.org/goldhub/data/gold-prices
[11] International Monetary Fund, World Economic Outlook database — Japan general government gross debt above 230% of GDP; Ministry of Finance Japan via Perplexity Finance macro history (2016-2024). https://www.imf.org/en/Publications/WEO
[12] International Monetary Fund and OMB Historical Tables for the United States debt-to-GDP path; U.S. general government gross debt near 125% of GDP in 2024-2025. https://www.imf.org/en/Publications/WEO and https://www.whitehouse.gov/omb/budget/historical-tables/
[13] Gold priced against the S&P 500 — LBMA gold fixings and S&P 500 year-end closes (1971-2006 annual anchors); Perplexity Finance monthly gold futures (GCUSD) and S&P 500 (^GSPC), 2007-2026.
[14] Perplexity Finance weekly closes — CBOE 10-Year Treasury Yield Index (^TNX) near 4.7% and ICE U.S. Dollar Index (DX-Y.NYB) drifting lower through 2025-2026.
[15] Falsification condition set by the author: a sustained 10-year real yield above ~2.5% (e.g., the 10-year TIPS yield, FRED series DFII10) alongside a firm dollar and no gold breakout would invalidate the fiscal-dominance read. https://fred.stlouisfed.org/series/DFII10
The Lead-Lag Report is provided by Lead-Lag Publishing, LLC. All opinions and views mentioned in this report constitute our judgments as of the date of writing and are subject to change at any time. Information within this material is not intended to be used as a primary basis for investment decisions and should also not be construed as advice meeting the particular investment needs of any individual investor. Trading signals produced by the Lead-Lag Report are independent of other services provided by Lead-Lag Publishing, LLC or its affiliates, and positioning of accounts under their management may differ. Please remember that investing involves risk, including loss of principal, and past performance may not be indicative of future results. Lead-Lag Publishing, LLC, its members, officers, directors and employees expressly disclaim all liability in respect to actions taken based on any or all of the information on this writing.



