The Dollar Is at a 19-Month High. Japan Intervened Twice This Year and the Yen Is Back at 160.
The dollar index closed at 103.17, its highest since April 2025. The yen is back at 160 after two interventions. A region-by-region look at a rate-driven dollar.


Today’s Lead-Lag Report post is sponsored by Xash
 |
 |
Grow your gold stack without buying another ounce
Put your stablecoins to work in DeFi and stack gold. Xash is one app for lending, liquidity and trades, minus the complexity. Withdraw your gold to your own wallet. No fees charged.
| Create free account |
Gold rewards are not guaranteed. Your money can lose value if a DeFi platform fails or the market moves sharply.
DISCLAIMER – PLEASE READ: This is sponsored advertising content for which Lead-Lag Publishing, LLC has been paid a fee. The information provided in the link is solely the creation of Xash, Inc. Lead-Lag Publishing, LLC does not guarantee the accuracy or completeness of the information provided in the link or make any representation as to its quality. All statements and expressions provided in the link are the sole opinion of Xash, Inc., and Lead-Lag Publishing, LLC expressly disclaims any responsibility for action taken in connection with the information provided in the link.
The Dollar Is at a 19-Month High. Japan Intervened Twice This Year and the Yen Is Back at 160.
The dollar index closed at 103.17 on Nov. 12, its highest since April 2025. Tokyo has intervened twice this year to defend 160 yen per dollar, and the yen is back there anyway. Region by region, this is a story about interest rates, and it does not look the same in Europe, Japan and emerging markets.
MICHAEL A. GAYED, CFA
Key Highlights
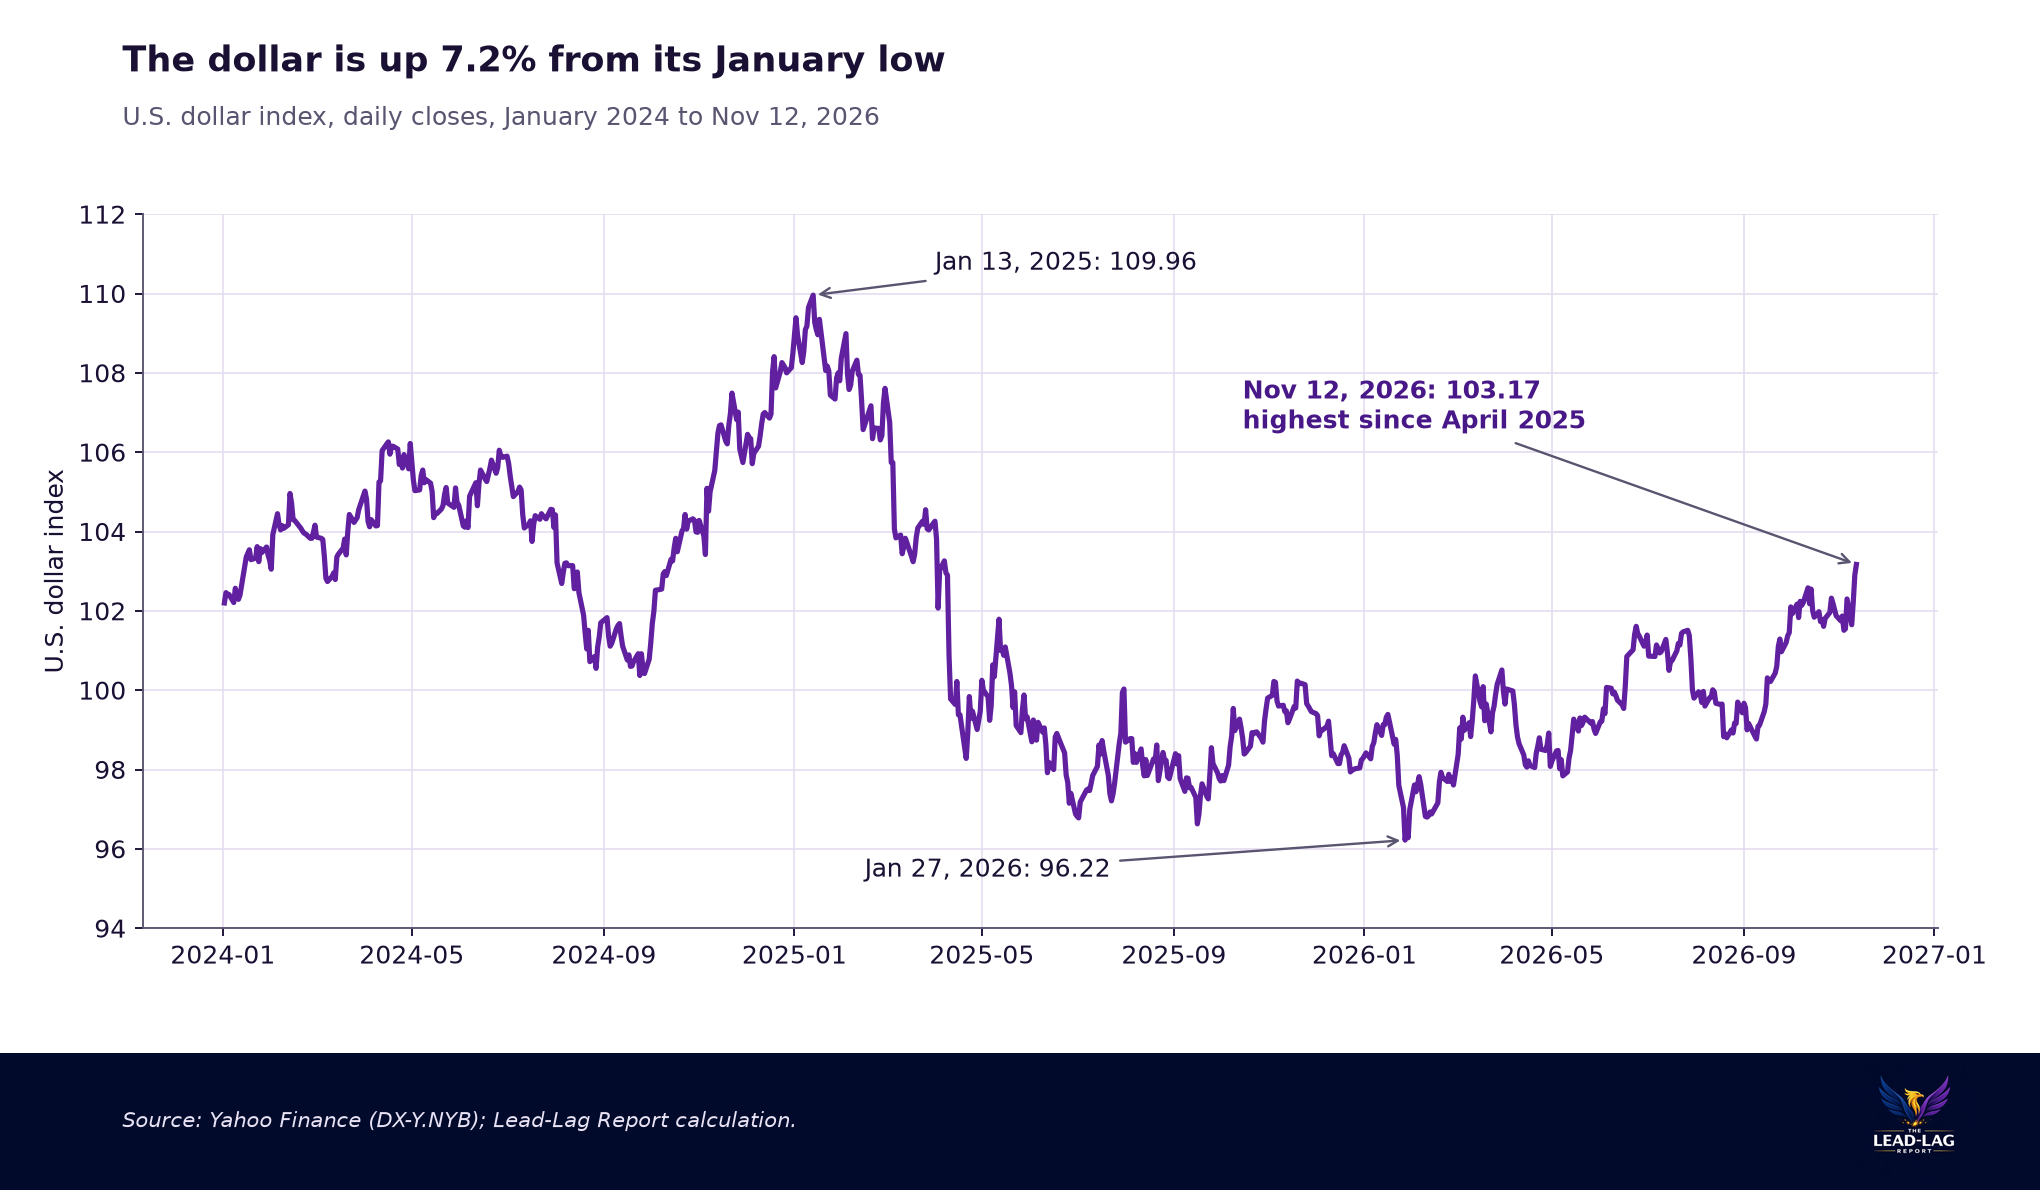
- The U.S. dollar index closed at 103.17 on November 12, its highest since April 2025. It is up 7.2% from its January 27 low of 96.22 and 5.0% in 2026, by my calculation.1, 2
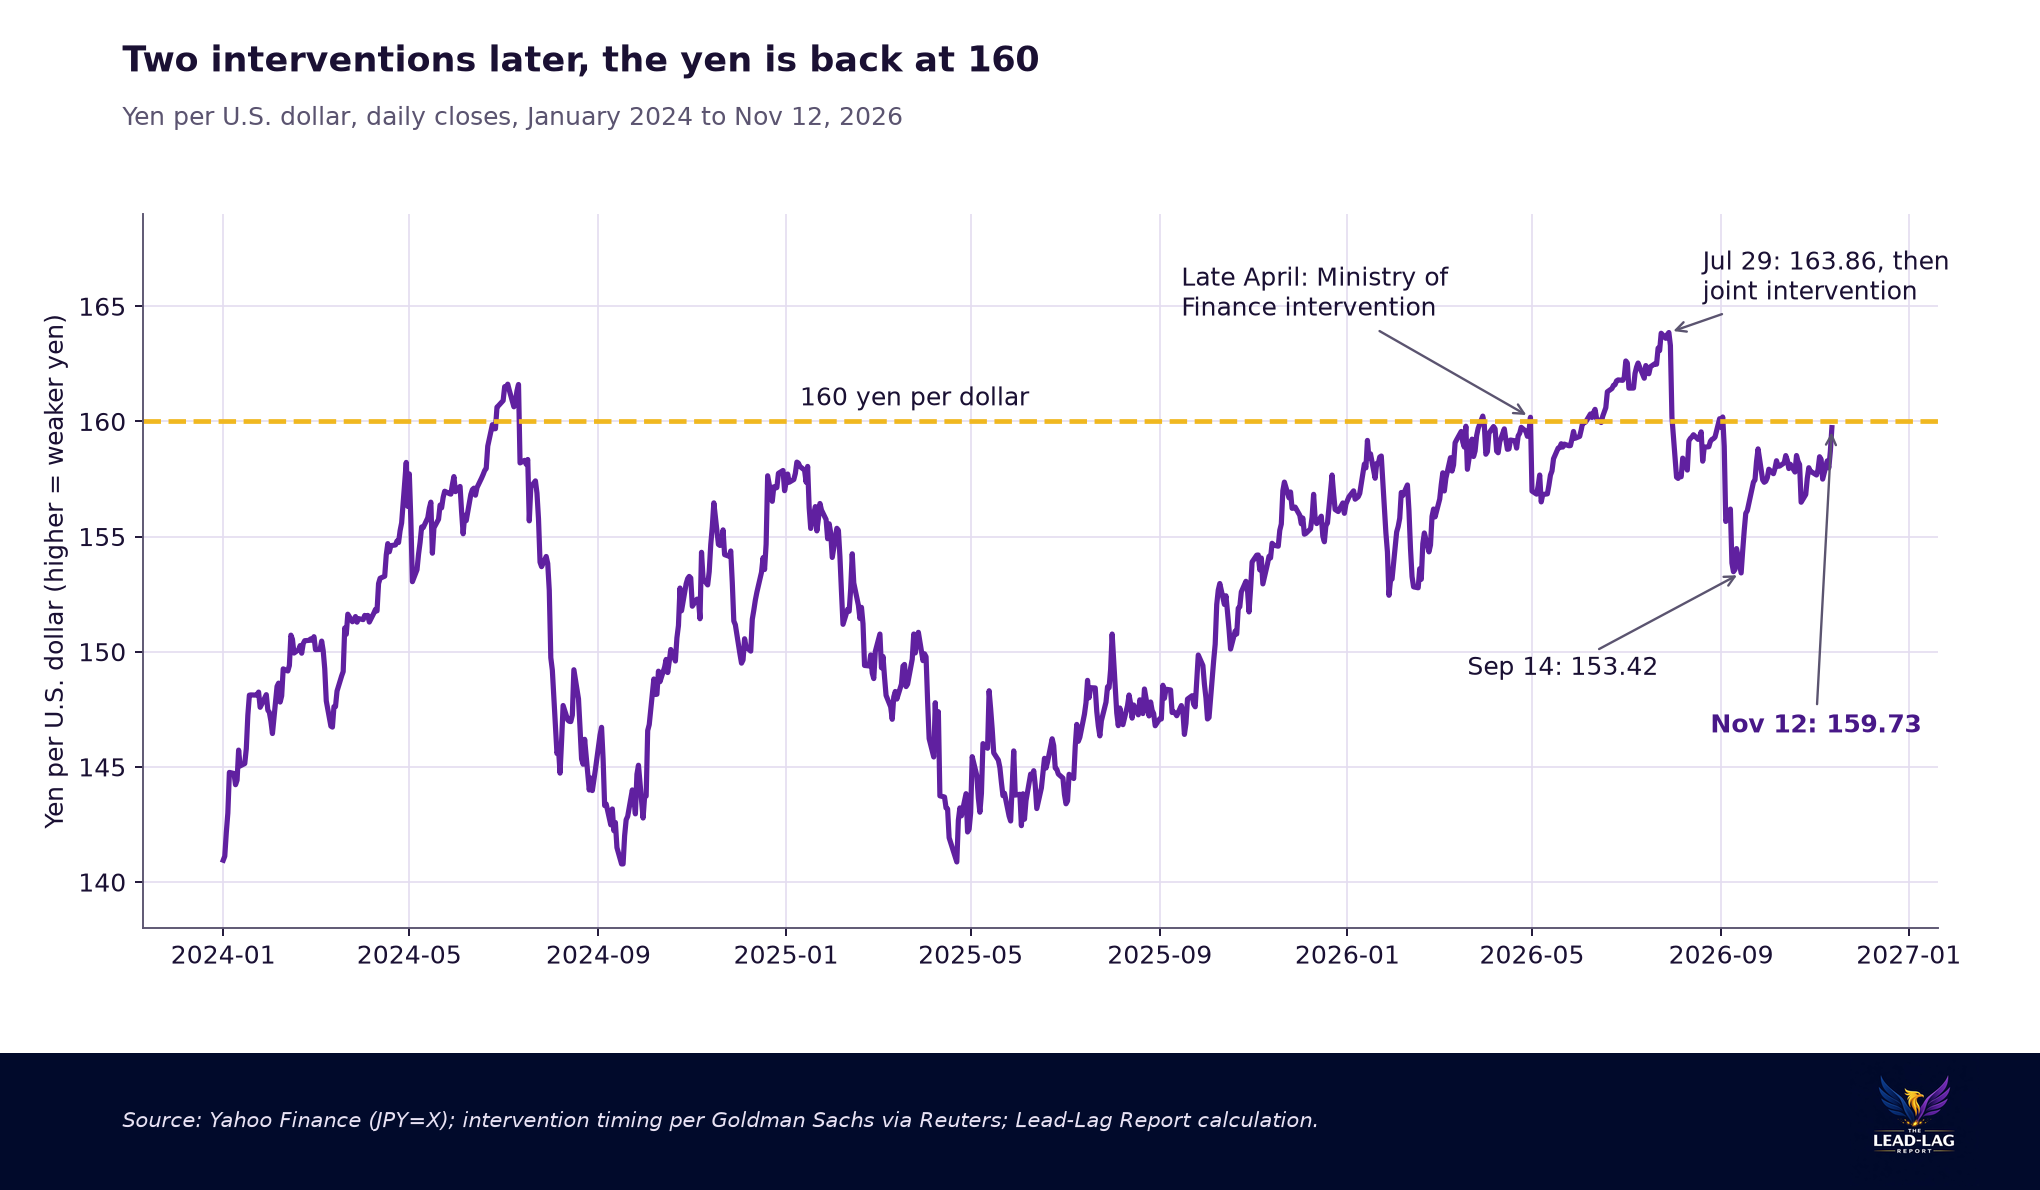
- The yen crossed 160 per dollar on November 12 for the first time since early September. It has closed at or beyond 160 on 43 days this year, against 11 days in 2024 and none before that in data back to 1996.2, 3
- Traders price a Federal Reserve hike on December 9 at 100%, with 86% odds of a quarter point and about 14% of a half point. The two-year Treasury yield was 4.867% on Thursday against a Bank of Japan policy rate of 1.25%.1, 4, 6
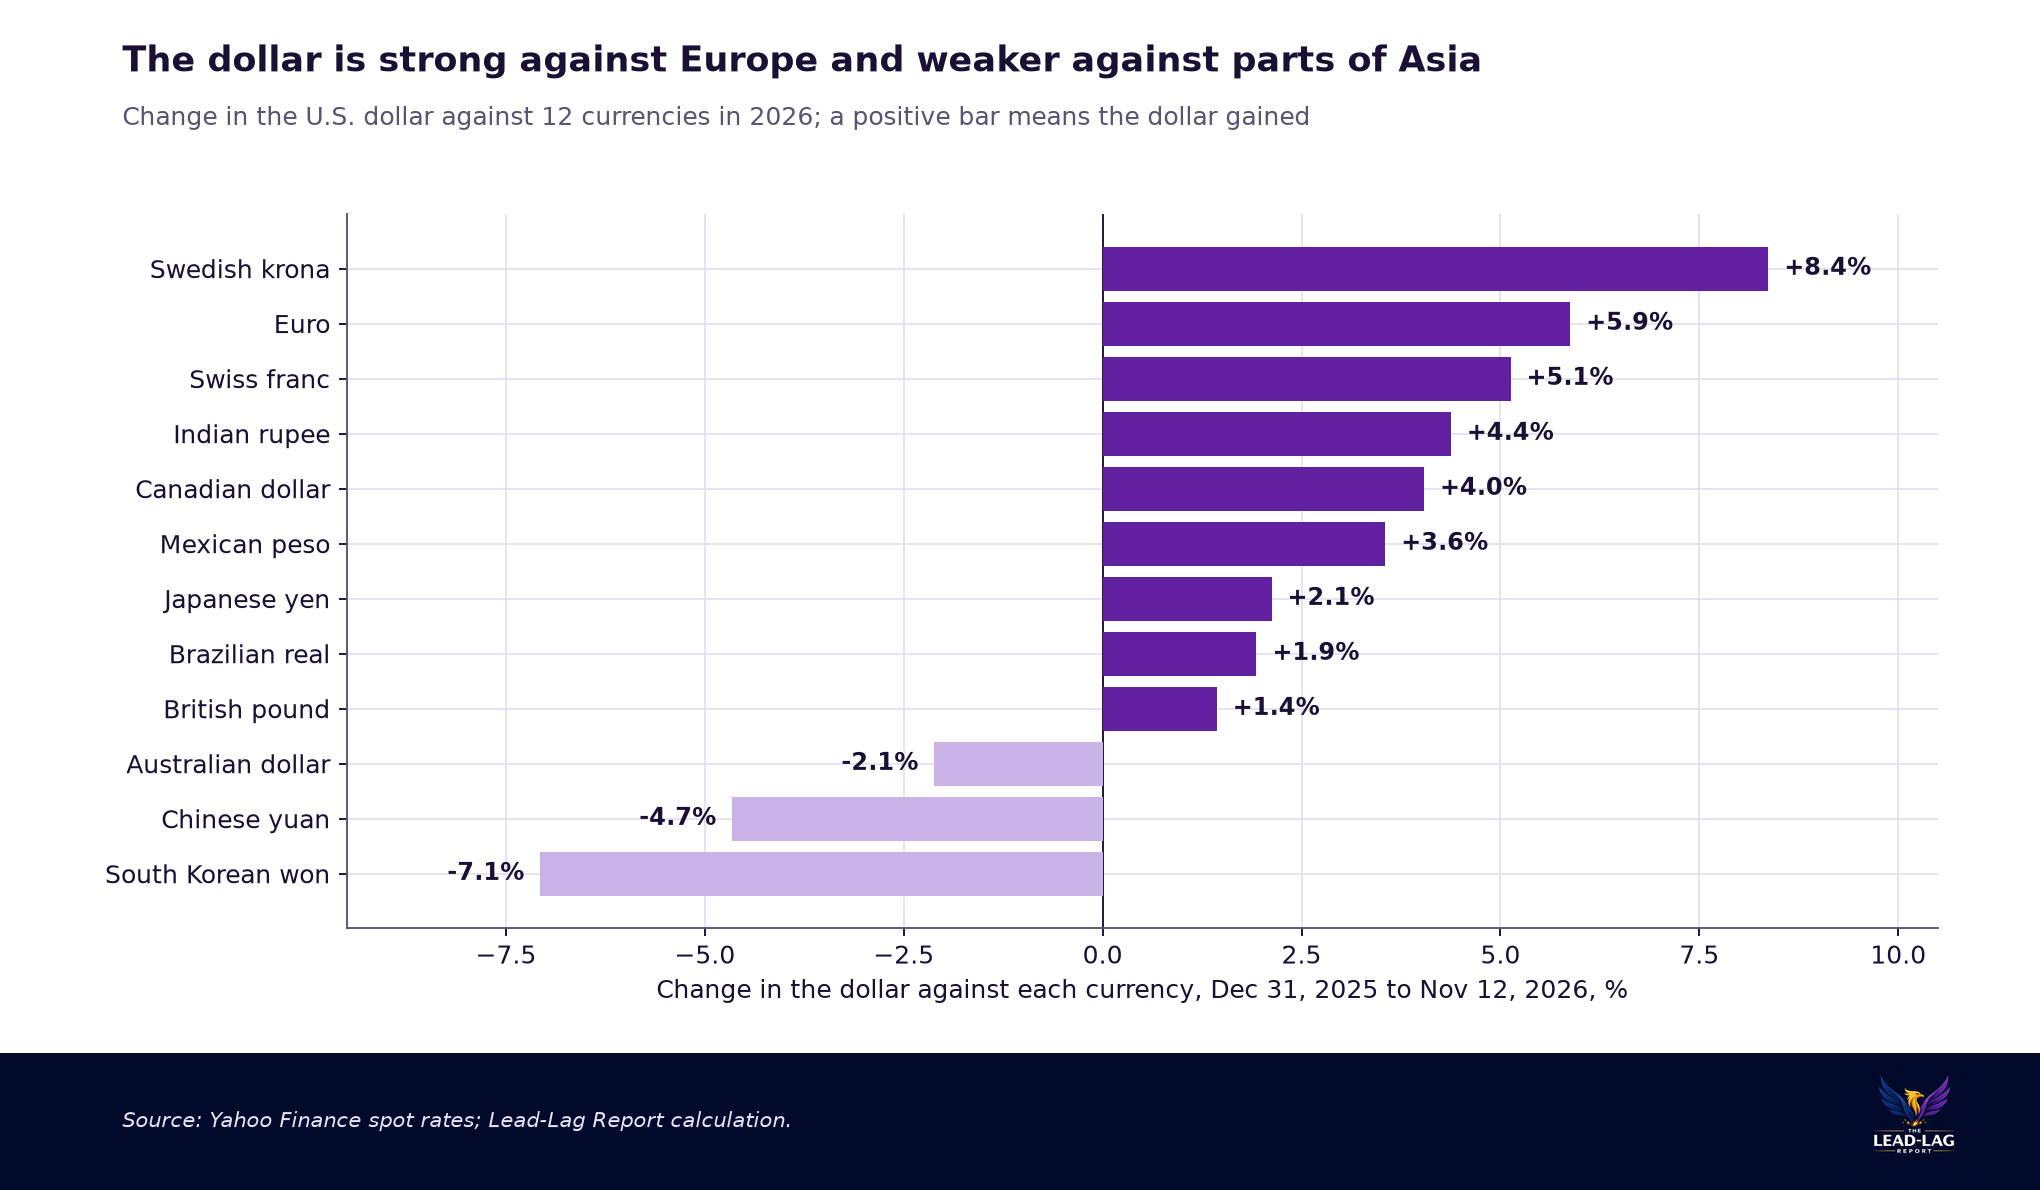
- In 2026 the dollar is up 8.4% against the Swedish krona and 5.9% against the euro, but down 7.1% against the South Korean won and 4.7% against the Chinese yuan.2
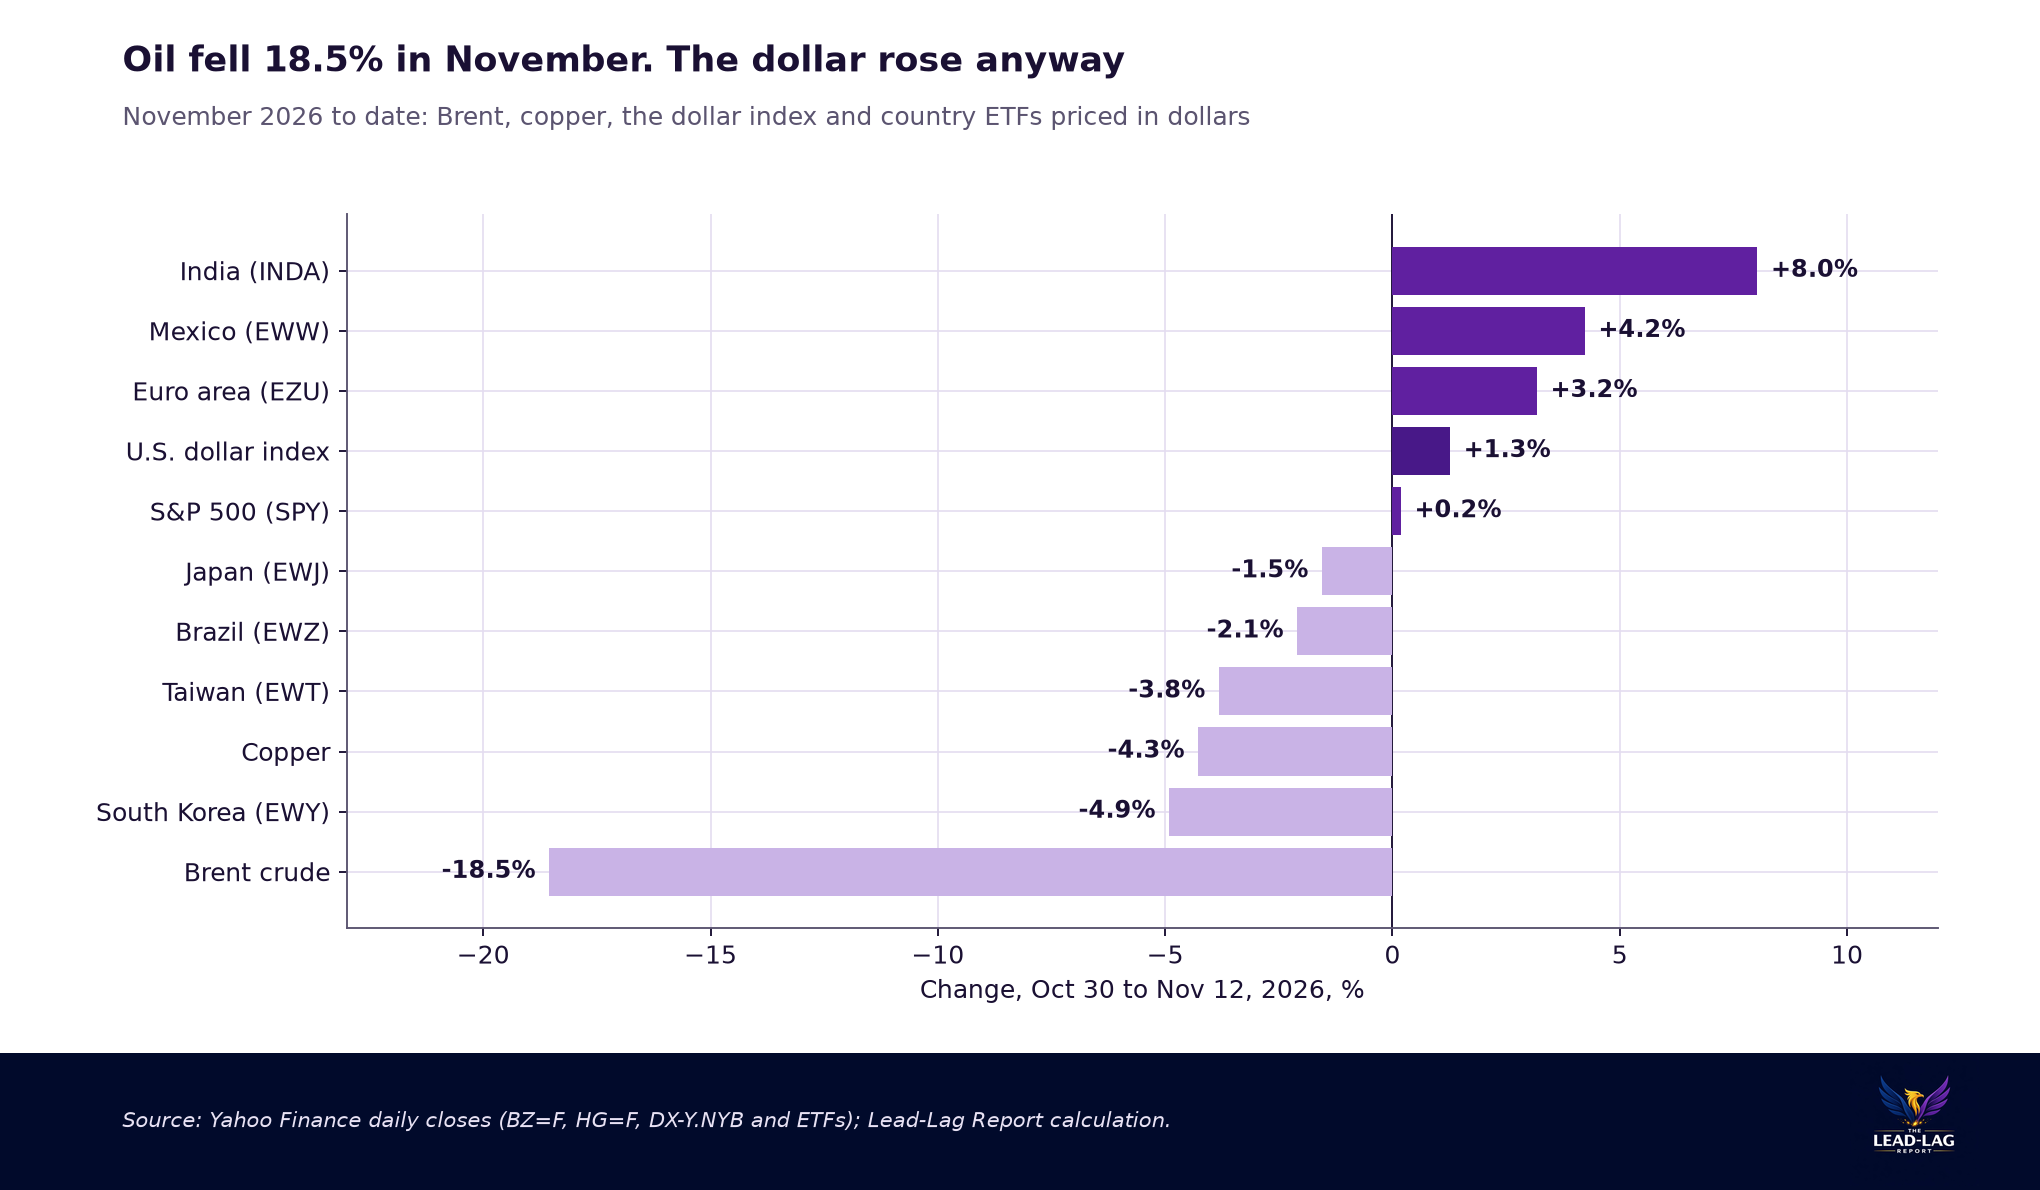
- Brent crude has fallen 18.5% in November, from $117.64 to $95.82, and the dollar index has still gained 1.3% this month.2, 6, 12
The Dollar Is A Rate Story, Not A Haven Story
The U.S. dollar index closed at 103.17 on November 12. Reuters called it the highest level in about 19 months, and my daily data agree: the last higher close was in early April 2025.1, 2 The index is up 7.2% from its low of 96.22 on January 27 and 5.0% for the year.2
The timing tells you what kind of rally this is. The dollar has gained almost 1.5% since Tuesday's inflation report, which came in hotter than expected and was followed by a run of hawkish remarks from Federal Reserve officials.7, 14 Eugene Epstein of Moneycorp told Reuters the dollar "has strengthened almost exclusively based on Fed expectations."1
My read is that this is a rate rally, not a fear rally, and the difference matters for how it travels around the world. A fear rally lifts the dollar against everything at once. A rate rally lifts it most against the currencies whose central banks cannot or will not keep up, and leaves alone the ones with their own story. That is what the numbers show. The dollar is strong against Europe and Japan, and it is weaker this year against parts of Asia.
The clearest example is Japan. Tokyo has intervened twice this year to stop the yen's slide, once with Washington's help, and the yen crossed 160 per dollar again on Thursday.1, 3 Intervention changes who is buying yen on a given day. It does not change what the yen pays.
The United States: A Hike Fully Priced
The Fed's target range is 3.75% to 4%.6 Traders now put the odds of an increase at the December 9 meeting at 100%, according to CME FedWatch figures reported by CNBC, with 86% on a quarter point and about 14% on a half point.4 Reuters reported that Fed officials have left open the possibility of the larger move, and that some brokerages, Goldman Sachs among them, now expect another hike early next year on top of December's.14
The bond market has moved with it. The two-year Treasury yield, the maturity that tracks Fed expectations most closely, rose almost 14 basis points on Thursday to 4.867%.1 The 10-year yield ended Thursday near 5.10%.15
For an American household the dollar's rise is mostly good news. Imports and foreign travel get cheaper. A trip to the euro area costs about 6% less in dollar terms than it did in January and a trip to Japan about 2% less, before any change in local prices.2
For an American investor it cuts the other way. Anything held abroad without a currency hedge is worth less when converted back. The S&P 500 ETF is up 11.9% this year. The euro-area ETF, which is priced in dollars, is up 6.8%, while the Stoxx Europe 600 index in local currency is up 12.0%.15 Those are not identical baskets, so treat the comparison as rough, but most of that gap is the currency.
Japan: Two Interventions, Same Line
For most of the last three decades, 160 yen per dollar was a level nobody had to think about. In daily closing data going back to late 1996, the yen never closed weaker than 151.65 before 2024. It closed at or beyond 160 on 11 days in 2024, all between June 27 and July 11. In 2026 it has done so on 43 days, the first on March 30.2
Japan has pushed back twice. Goldman Sachs analysts quoted by Reuters describe intervention by the Ministry of Finance in late April and a joint intervention starting in late July, which Investing.com called an unprecedented joint action by Tokyo and Washington.1, 3 Both show up in the closing data. The yen closed at 160.18 on April 30 and was at 156.51 a week later. It closed at 163.86 on July 29, its weakest close in my data, and was at 157.60 three sessions later. It drifted back to 160 by the end of August, fell again in early September after what Goldman described as rate checks, and reached 153.42 on September 14.1, 2
None of it lasted. At Thursday's close of 159.73 the yen had given back about 60% of everything it gained between late July and mid-September, in two months.2
Officials are talking again. Japan's top currency diplomat, Atsushi Mimura, said on Thursday that it was "too early to forget" this summer's intervention. Finance Minister Satsuki Katayama warned on Friday against "one-sided" moves and promised to "respond appropriately."1, 3
The reason the line keeps getting tested is arithmetic. The Bank of Japan held its policy rate at 1.25% on October 30.6 The two-year Treasury yields 4.867%.1 An investor holding dollars instead of yen collects that difference every day the exchange rate does not move against them. The Bank of Japan is expected to raise rates in December, and it has reason to: Japan's wholesale inflation re-accelerated to 7.1% in the year to October from 6.8% in September, and a weaker yen makes every imported good more expensive.1, 3 But a quarter point in Tokyo does little against a gap of roughly three and a half points, especially in a month when the Fed is expected to move too.
There is one detail in Tokyo's favor. Goldman's analysts noted that on a trade-weighted basis the yen is still almost exactly 1% stronger than before April's intervention and around 2.6% stronger than before July's.1 The yen looks worst against the dollar because the dollar is the thing that is moving. By the broad measure, Japan has room before it reaches the levels where it acted. By the headline number, it is already there.
Europe: A Central Bank That Expects To Stop
The euro fell to $1.1055 on Thursday, its lowest against the dollar since April 2025.1 It lost about 1.3% across Tuesday and Wednesday alone.8 The dollar is up 5.9% against the euro this year, 5.1% against the Swiss franc and 8.4% against the Swedish krona, the largest move among the twelve currencies I track.2
Europe is raising rates too, which makes the weakness look odd at first. The European Central Bank's deposit rate is 2.50%.6 Three policymakers told Reuters after the October meeting that a hike on December 17 to 2.75% was all but certain, barring a sudden collapse in energy prices, and that they expected to pause after that.5
The pause is the point. Currencies trade on where rates are going next, not where they are. A Societe Generale strategist put it plainly to Reuters this week: the ECB is "probably going to stop raising rates after the December meeting," so "the spread is going to widen further in favour of the US dollar."8 Rabobank expects the euro to reach $1.10 within three months, according to Dow Jones.13
European stocks have not minded so far. The Stoxx Europe 600 has gained 2.7% in November in local terms and the euro-area ETF 3.2% in dollars.15 A weaker euro helps exporters. It also raises the price of every barrel of oil Europe buys, which is the last thing a central bank fighting energy-led inflation wants.
Emerging Markets: The Dollar Is Not Winning Everywhere
"Strong dollar" is shorthand for an index built from six developed-market currencies, most of it euro. It contains no yuan, no won, no rupee and no real. Break the dollar apart by country and the picture is uneven.
Against the South Korean won the dollar is down 7.1% this year. Against the Chinese yuan it is down 4.7%.2 The South Korea ETF is up 49.5% in 2026 and the Taiwan ETF 53.1%, so the won at least has had money flowing toward it.15 China is harder to explain that way. The China ETF is down 16.6% this year even as the yuan has gained, and it has lost 3.4% since Monday.15
India is this month's surprise. The rupee hit a record low of 96.96 per dollar on May 20, and it closed around 93.69 on November 11, its strongest since April.11 The dollar has lost 1.5% against the rupee in November and the India ETF has gained 8.0%.2, 15 Dow Jones reported that the won and the rupee are holding up better than their regional peers, with OCBC strategists crediting renewed foreign portfolio inflows for the rupee's resilience.9
The other end of the range is uncomfortable. Indonesia's rupiah fell to a record low of 18,247 per dollar on Thursday, passing the previous low of 18,188 set on June 8, with domestic political uncertainty adding to the dollar's pull.10 The dollar has gained 3.7% against the Brazilian real in November, and the Brazil ETF has lost 2.5% since Monday.2, 15 Lloyd Chan of MUFG told Dow Jones that a firmer dollar, higher U.S. yields and elevated oil prices make for a tough near-term backdrop for Asian currencies.9
The lesson I take is that a rate-driven dollar sorts emerging markets by their own fundamentals instead of selling them as a group. Countries with inflows hold. Countries with a political problem or a funding gap get tested first.
Commodities: Oil Fell 18.5% And The Dollar Still Rose
Commodities are priced in dollars, so a stronger dollar makes them more expensive for everyone else. That usually weighs on prices. This month the two have moved for separate reasons.
Brent crude settled at $117.64 on October 30 and at $95.82 on November 12, a decline of 18.5%, as hopes for a resolution to the Iran conflict took some of the risk premium out of the market.6, 12, 16 Thursday's session was a reminder that the premium can come back: Brent jumped 3.3% on reported attacks on Saudi energy sites and disruptions in the Strait of Hormuz.12 Copper has lost 4.3% in November and 2.3% since Monday.15
For oil importers, that fall in crude has done more than the dollar has undone. Japan's yen has lost 1.2% against the dollar this month, so a barrel of Brent still costs roughly 17% less in yen than it did at the end of October.2 The same arithmetic helps India and explains part of the rupee's strength.9
It also sets a trap. If oil turns higher again while the dollar stays strong, importers get both at once. Japan's wholesale inflation re-accelerated in October, a month when Brent rose 13.6%.1, 6
What It Means For A Portfolio
Three practical points follow.
First, know what currency your foreign holdings are really in. An unhedged European fund has given back a large part of its local return to the currency this year. That is arithmetic, not a forecast, and it reverses if the dollar does.
Second, do not treat "emerging markets" as one position against the dollar. This year the won, the yuan, the rupee, the real and the rupiah have each done something different.
Third, do not count on intervention to turn a currency. It has bought Japan a few weeks at a time, twice, and the yen is back at the same line.
The Case Against Me
The strongest argument against my view is that the good news for the dollar is already in the price. A December hike is priced at 100%.4 There is no room left for the market to become more certain about it, only less. If the Fed delivers a quarter point and sounds cautious, the dollar could fall on the day it gets what it wanted.
Second, the other side is moving too. The Bank of Japan is expected to hike in December and the ECB is all but certain to.3, 5 Three central banks tightening together does not obviously favor one of them.
Third, this is not a historic level. The dollar index is still about 6% below its January 2025 high of 109.96.2 A 19-month high after a long decline is a recovery, not a breakout.
Fourth, July's intervention was a joint one.1, 3 If Washington is willing to help Tokyo defend the yen, then the United States does not want an unlimited rise in its own currency either, and that is a different opponent from the Ministry of Finance alone.
What Would Change My View
- The yen closes back below 155 without intervention. That would say the rate gap has stopped driving the currency and something else has taken over.2
- The Fed hikes a quarter point on December 9 and the two-year yield falls. That would say the market has priced the last hike, and the dollar's main support is gone.1, 4
- The ECB drops the talk of a pause. If Europe signals more hikes in 2027, the widening gap that is weighing on the euro closes.5, 8
- The dollar starts rising against the won and the yuan as well. That would turn a rate rally into a broad one, and it would mean stress, not just yield, is behind the move.2
How This Fits What I Have Written
The November 1 edition noted that the yen ended October at 157.80, almost unchanged on the month, and that it was not acting as a haven in a war.6 Two weeks later it is weaker, not stronger, and the reason is the same one that edition gave for everything else: markets are pricing central banks, not fear. The dollar is the cleanest expression of that.
What I Am Watching Next Week
The 160 line comes first. The yen closed at 159.73 on Thursday.2 Either it closes beyond 160 and Tokyo has to decide whether a third round is worth it, or the warnings are enough for now. How officials respond will say more than the level.
Second, the euro at $1.10. It is the round number below Thursday's low and Rabobank's three-month target.1, 13
Third, the two ends of emerging markets: whether the rupee holds its gains and whether the rupiah finds a floor.10, 11
The dollar is not rising because the world is afraid. It is rising because the United States is paying more to hold it, and the countries that cannot match that are finding out what their currencies are worth without help.
Few understand this.
Notes
- [1] Reuters via Yahoo Finance, "Dollar hits 19-month high as hawkish Fed view lifts yields," November 12, 2026 (dollar index 103.17, euro $1.1055, Mimura, Goldman Sachs on intervention thresholds, Japan wholesale inflation 7.1%, two-year yield 4.867%, Epstein): ca.finance.yahoo.com/news/dollar-near-one-month-high-000930713.html
- [2] Yahoo Finance daily closes for the U.S. dollar index (DX-Y.NYB), USD/JPY (JPY=X) and eleven other spot rates, October 30, 1996 to November 12, 2026; all changes and day counts are my calculation: finance.yahoo.com/quote/JPY=X/
- [3] Investing.com via Yahoo Finance, "Japanese yen tests 160 again, drawing intervention threats," November 13, 2026 (first cross of 160 since early September, Katayama, joint intervention, BoJ expected to hike in December): au.finance.yahoo.com/news/japanese-yen-tests-160-again-032528721.html
- [4] CNBC, "10-year Treasury yield moves to 5.15% as traders weigh producer price report," November 13, 2026 (CME FedWatch odds for December 9): www.cnbc.com/2026/11/13/treasury-yields-fed-rates.html
- [5] Reuters via The Kansas City Star, "ECB governors see December hike likely followed by pause, sources say," October 29, 2026: www.kansascity.com/news/nation-world/national/article317833742.html
- [6] The Lead-Lag Report, Global View, November 1, 2026 (Fed at 3.75% to 4%, ECB at 2.50%, BoJ held at 1.25% on October 30, yen at 157.80, Brent settled at $117.64 on October 30, up 13.6% in October): www.leadlagreport.com/oil-rose-13-6-in-october-gold-fell-6-5-the-market-is-betting-on-the-central-banks/
- [7] Reuters via The Business Times, "European stocks hit record high after Nvidia storm rattles Asia," November 12, 2026 (dollar up almost 1.5% since the inflation data): www.businesstimes.com.sg/companies-markets/capital-markets-currencies/european-stocks-hit-record-high-after-nvidia-storm-rattles-asia
- [8] Reuters via Miami Herald, "Dollar drops slightly from 19-month highs, rate divergence in focus," November 12, 2026 (euro fell about 1.3% across Tuesday and Wednesday; Societe Generale on the ECB): www.miamiherald.com/news/business/article318039021.html
- [9] Dow Jones via Morningstar, "Asian Currencies Falter as Dollar Thrives," November 12, 2026 (MUFG and OCBC comments; won and rupee holding up): www.morningstar.com/news/dow-jones/202611121106/asian-currencies-falter-as-dollar-thrives
- [10] IDN Financials, "Gibran resignation fallout sends rupiah to record low," November 2026 (rupiah at 18,247 per dollar; previous low 18,188 on June 8): www.idnfinancials.com/news/71636/gibran-resignation-fallout-sends-rupiah-to-record-low
- [11] Business Today, "The Rupee bounces back, but the ₹100 threat isn't gone yet," November 12, 2026 (record low of 96.96 on May 20; 93.69 on November 11): www.businesstoday.in/latest/economy/story/bt-big-story-the-rupee-bounces-back-but-the-rs100-threat-isnt-gone-yet-566935-2026-11-12
- [12] Reuters via Yahoo Finance, "Oil settles $3 higher on attacks on Saudi energy sites, Strait of Hormuz disruptions," November 12, 2026 (Brent settled at $95.82, up 3.3%): ca.finance.yahoo.com/news/oil-falls-over-1-easing-045152522.html
- [13] Dow Jones via Morningstar, "Euro Falls to 18-Month Low Against Dollar on Fed Rate-Hike Bets," November 11, 2026 (Rabobank target of $1.10): www.morningstar.com/news/dow-jones/202611115543/euro-falls-to-18-month-low-against-dollar-on-fed-rate-hike-bets
- [14] Reuters via Fidelity, "Dollar rises to 19-month high as Fed hike bets grow, yen wobbles," November 12, 2026 (Fed officials on a 50-basis-point move; Goldman Sachs expects another hike early next year): www.fidelity.com/news/article/default/202611120221RTRSNEWSCOMBINED_L2N46T05A_1
- [15] Yahoo Finance daily closes for SPY, EZU, EWY, EWT, MCHI, INDA, EWZ, the Stoxx Europe 600 (^STOXX), the 10-year Treasury yield (^TNX), Brent (BZ=F) and copper (HG=F) through November 12, 2026; returns are my calculation: finance.yahoo.com/quote/SPY/
- [16] NDTV Profit, "Oil Prices Today: Brent Reverses Course, Climbs Above $95; What Happens Next?" November 12, 2026 (November decline tied to expectations of a resolution to the U.S.-Iran conflict): www.ndtvprofit.com/markets/oil-prices-today-november-12-brent-crude-oil-wti-reverses-course-climbs-above-95-what-happens-next-us-strait-of-hormuz-iran-war-middle-east-12320081/amp/1