Business Applications Hit a Record in July. Fewer Than 3 in 10 Look Like Future Employers.
Americans filed 575,501 business applications in July, a record. The share Census flags as likely employers has fallen to 28.8%, from about 59% in 2006.


Complimentary for advisors today: Website Development & Design

A full website that reflects your practice. Strategy, sitemap, copy framework, visual direction, technical requirements and launch planning for a full site, reviewed by the Website Desk.
What you receive
- Website scope brief
- Sitemap and page plan
- Page hierarchy and CTA map
- Homepage copy framework
- Interior page content plan
- Brand and visual direction
Cost in credits: 15. Turnaround: Scoped per engagement. Delivered as: Handled with the Creative Desk. Best for: Advisors with an outdated site or none at all.
It is complimentary for advisors. There is no invoice from us. You earn the credits by showing up: attend a sponsored Lead-Lag Media webinar, meet a fund issuer in a one-on-one introduction, or join one of our advisor dinners.
Prefer to browse first? See all 34 services at advisor.leadlagmedia.com.
Credits carry no cash value and are not payment for services. Drafts are prepared with AI assistance and are for your and your firm’s review before use; they are not investment, legal, tax or compliance advice, and nothing is guaranteed. Services are offered to financial advisors and are not a solicitation to retail investors. Domain, hosting, and premium third-party plugins/themes are advisor-paid.
Americans are filing to start businesses at a near-record pace. Fewer of those filings look like future employers than at any point in the data.
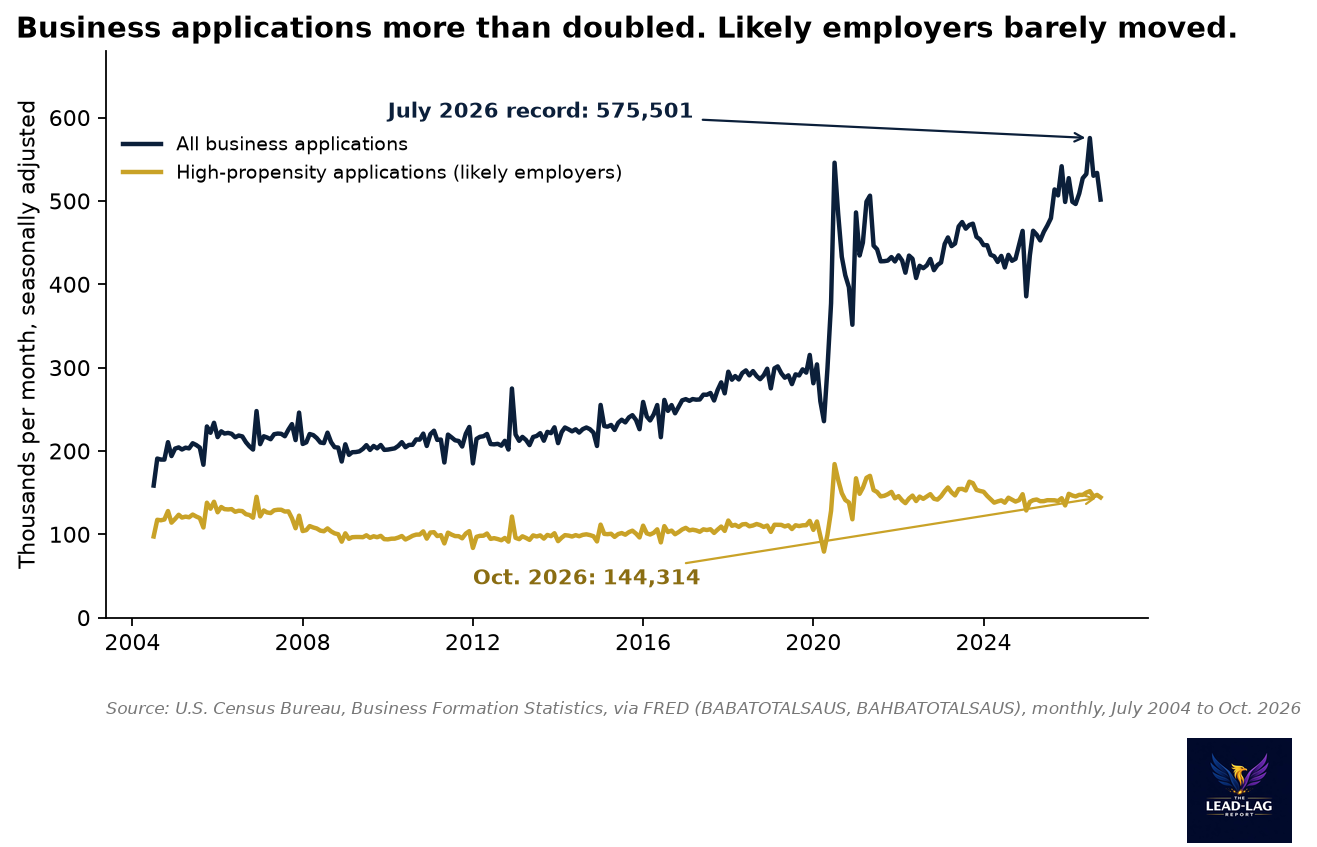
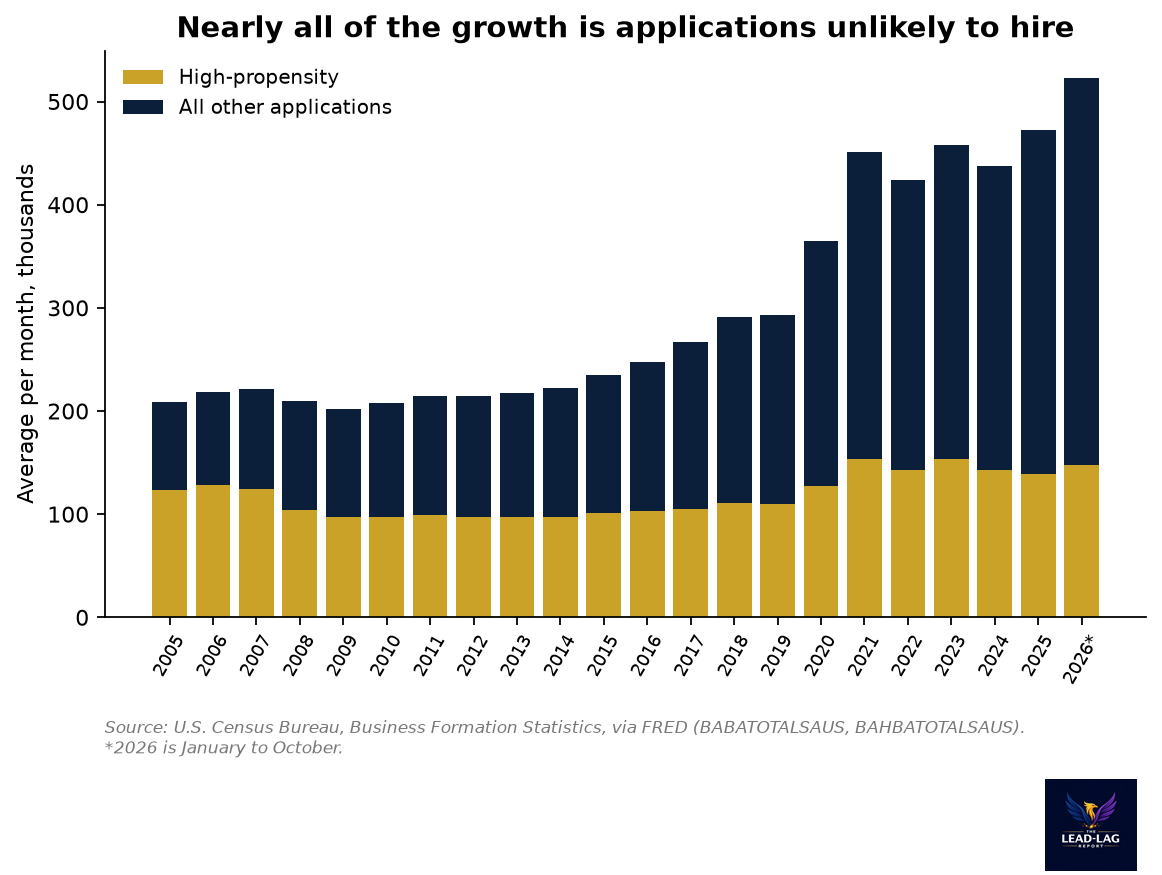
The Census Bureau counted 501,609 business applications in October, seasonally adjusted.[1] That was down 6.0% from September's 533,637, but it followed a record 575,501 in July.[1] Through the first ten months of 2026, applications have averaged about 523,000 a month, compared with about 473,000 in 2025 and 293,000 in 2019.[1]
The headline sounds like an entrepreneurship boom. The detail says something narrower. Census separates out "high-propensity" applications, the filings it judges most likely to turn into businesses with a payroll, based on signals such as planned wages, a corporate structure or the type of industry.[2][3] Those came to 144,314 in October.[2] In 2006 they averaged about 129,000 a month.[2]
The mix changed, not the employers
Put the two series side by side and the story is about composition. Total applications have more than doubled since 2006, from about 218,000 a month to about 523,000.[1] High-propensity applications are up roughly 15% over the same span, from about 129,000 to about 147,000.[2]
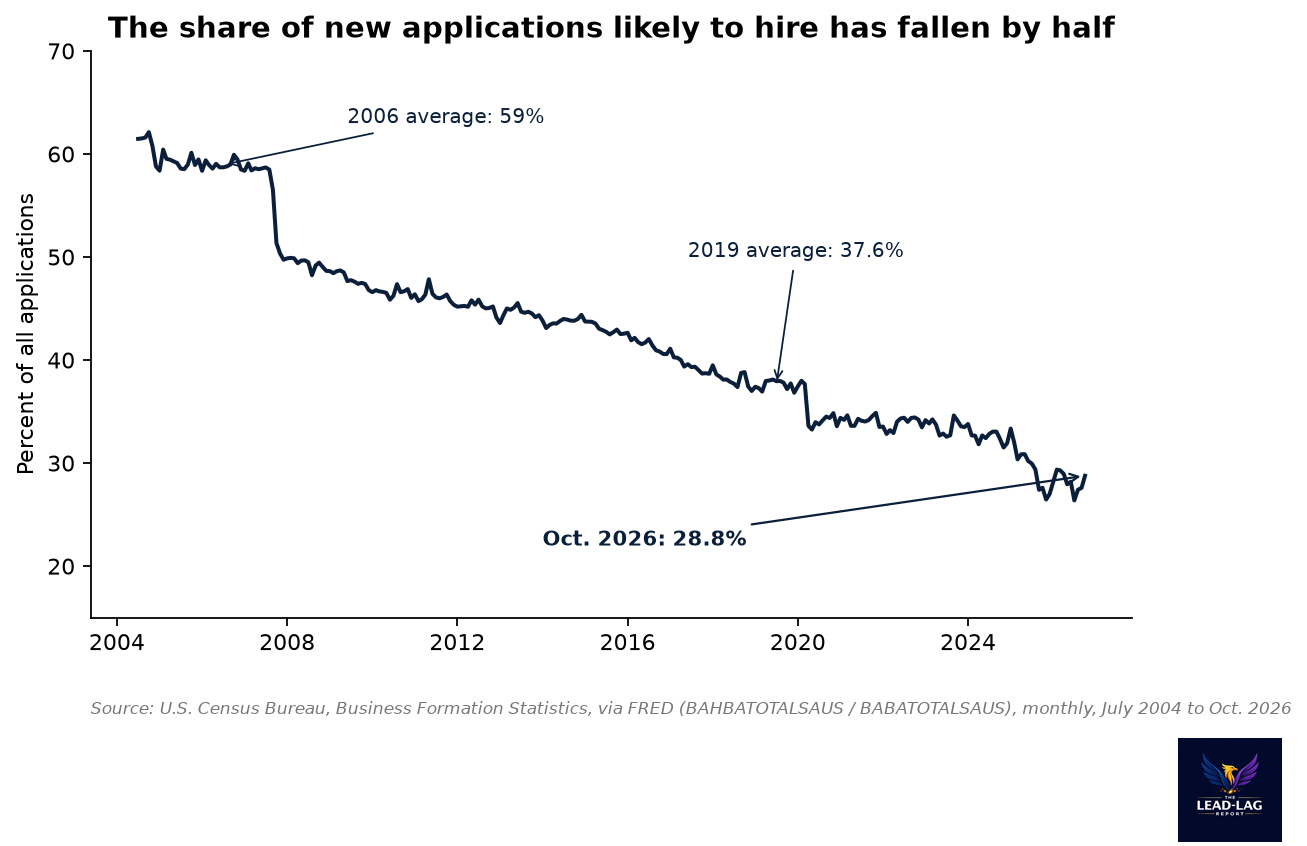
That means the share of applications that look like future employers has fallen from about 59% in 2006 to 37.6% in 2019 and 28.8% in October.[1][2] The decline was gradual through the 2010s, stepped down in 2020 and has kept sliding since. Readings below 30% first appeared in July 2025, and the low so far was 26.4% in July 2026.[1][2]
The rest of the applications are the growth. Filings that Census does not flag as likely employers averaged about 90,000 a month in 2006, about 183,000 in 2019 and about 376,000 so far in 2026.[1][2] Those are mostly sole proprietors, freelancers, side businesses and single-member companies. Many will never hire anyone. Some will never report revenue at all.
Why it matters for the jobs story
Business applications are often cited as a leading indicator for hiring, on the logic that new firms create a large share of new jobs. That logic depends on the high-propensity slice, not the total. On that slice, 2026 looks a lot like 2021 through 2025: steady, a bit above its pre-pandemic level, and nowhere near the surge in the headline.[2]
That fits other parts of the labor picture. Initial jobless claims are near their lowest since 1969, but hiring has been slow, and a growing share of work is happening outside traditional payrolls.[4] A filing for an employer identification number costs little and takes minutes, so the total count reacts quickly to things like gig platforms, contract work and people formalizing side income. It says less about where the next wave of payroll jobs will come from.
It also helps explain why the jump in applications after 2020 has not shown up as an obvious jump in new-firm employment. The applications that are most likely to become employers rose in 2020 and 2021, then flattened. The remainder kept climbing.[1][2]
The year-over-year view
October also offers a cleaner comparison than the month-to-month change. Against October 2025, total applications were down 1.0%, while high-propensity applications were up 3.2%.[1][2] That is a small move, but it runs in the opposite direction of the long-term trend. It is one reason the share ticked up to 28.8% from 27.6% in September.[1][2]
One month does not reverse a twenty-year slide. Still, it is the kind of detail that gets lost when the only number reported is the total. A falling headline with rising employer-type filings is a different signal from a falling headline across the board.
What it looks like from the client side
For advisors, the shift shows up in client conversations before it shows up in macro data. More households now have some form of business income alongside a paycheck: consulting work, a small online store, rental activity run through an LLC, or a spouse who went independent. Each of those filings is one of the applications in the total line.
That kind of income is lumpier than a salary and usually comes without an employer retirement plan or benefits attached. It changes how cash flow, taxes and savings decisions get made, even when the business never grows past one person. The total application count is, in a sense, a running tally of how many households are taking on that complexity.
What to watch
Three things are worth tracking as the monthly reports come in.
First, whether high-propensity applications break out of the 140,000 to 155,000 range where about three in four monthly readings have landed since 2022.[2] A sustained move higher would be a more meaningful signal for future hiring than any record in the total.
Second, whether the October drop in total applications is noise after a record July or the start of a slower stretch. Total applications moved 5% or more in 13 of the last 58 months, roughly one month in five, so a single reading proves little.[1]
Third, the share itself. At 28.8%, it has bounced off July's low of 26.4%.[1][2] If it stabilizes, the headline and the employer story will start to move together again. If it keeps sliding, record application counts will keep overstating how much new business formation is feeding the job market.
For markets, the practical read is that "record new businesses" headlines say more about how Americans are earning money than about how many employers are coming. The number to watch is the one that rarely makes the headline.
Notes
- FRED, Business Applications: Total for All NAICS in the United States (BABATOTALSAUS), U.S. Census Bureau, monthly, seasonally adjusted, through October 2026
- FRED, High-Propensity Business Applications: Total for All NAICS in the United States (BAHBATOTALSAUS), U.S. Census Bureau, monthly, seasonally adjusted, through October 2026
- U.S. Census Bureau, Business Formation Statistics, Definitions
- The Lead-Lag Report, Jobless Claims Match the Lowest Since 1969. Sentiment Is Below 2008., Nov. 11, 2026
Paid members get the full Weekly Signals, the weekly Leaders and Laggards and every chart behind each call. Start with 7 days free.
The Lead-Lag Report is provided by Lead-Lag Publishing, LLC. All opinions and views mentioned in this report constitute our judgments as of the date of writing and are subject to change at any time. Information within this material is not intended to be used as a primary basis for investment decisions and should also not be construed as advice meeting the particular investment needs of any individual investor. Trading signals produced by the Lead-Lag Report are independent of other services provided by Lead-Lag Publishing, LLC or its affiliates, and positioning of accounts under their management may differ. Please remember that investing involves risk, including loss of principal, and past performance may not be indicative of future results. Lead-Lag Publishing, LLC, its members, officers, directors and employees expressly disclaim all liability in respect to actions taken based on any or all of the information on this writing.