
The Simplest 6% In The Income Market Is A Pure Bet On Rates
Invesco Preferred ETF (PGX) pays 6.31% from 265 mostly investment-grade preferred securities with no leverage and no derivatives. The price has fallen from $15.60 to $10.67 since 2020, and whether that reverses depends entirely on the Fed.

KEY HIGHLIGHTS
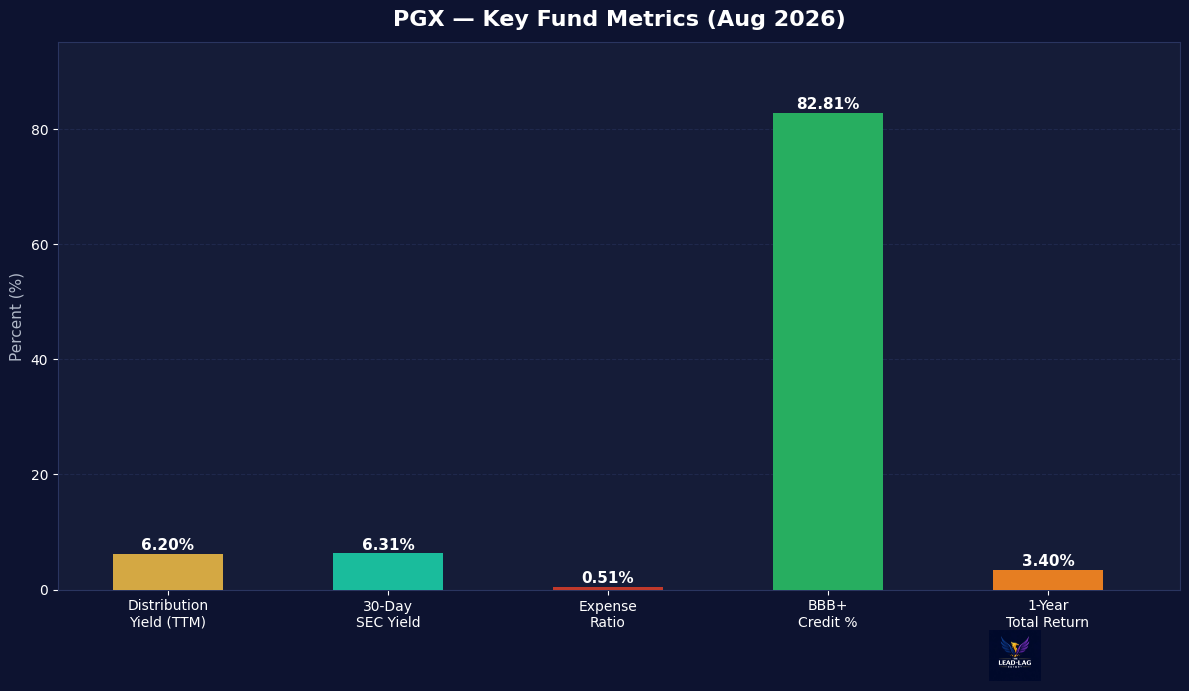
Yield: 6.20% TTM | 6.31% 30-Day SEC Yield
Rate sensitivity: 99.6% of holdings mature beyond 5 years -- fixed-rate preferred securities move inversely with rates; -21% in 2022 rate-hike year
Credit quality: 78.4% BBB-rated, 4.4% A-rated -- investment-grade core with 16.8% sub-IG tail
Price decay: From ~$15.60 (2020) to ~$10.67 today -- structural headwind from 2022 rate regime shift, now potentially reversing
AUM: $3.79B | Expense ratio: 0.51%
Every week, we'll profile a high yield investment fund that typically offers an annualized distribution of 6-10% or more. With the S&P 500 yielding less than 2%, many investors find it difficult to achieve the portfolio income necessary to meet their needs and goals. This report is designed to help address those concerns.

Most of what gets sold as high yield in 2026 comes wrapped in machinery. Leverage that amplifies both directions, options overlays that cap the upside you needed, closed-end fund discounts that widen precisely when you want liquidity, distributions padded with return of capital so the headline rate survives a portfolio that cannot support it. Once you unwind the structure, the answer is usually disappointing.
So it is worth pausing on a fund where there is nothing to unwind. No borrowing, no swaps, no managed distribution policy, no discount to time. Just preferred securities issued mostly by large American banks, throwing off cash every month. The complexity is not in the wrapper. It is in the single macro variable the entire position rides on.
The Invesco Preferred ETF (PGX) is that fund. It holds 265 preferred securities tracking the ICE BofAML Core Plus Fixed Rate Preferred Securities Index, manages $3.79 billion, charges 0.51%, and yields 6.31% on a 30-day SEC basis against a trailing twelve-month distribution yield near 6.20% ([Invesco](https://www.invesco.com/us/en/financial-products/etfs/invesco-preferred-etf.html)). Shares trade around $10.67 against a NAV of $10.71, as you would expect from an ETF with real creation and redemption flow. There is no valuation game to play here. What there is instead is a price that stood near $15.60 in January 2020 and sits at $10.67 today, and that decay is the whole story.
Fund Background
PGX launched in January 2008, so it has been marked through the financial crisis, a decade of zero rates, a pandemic, and the fastest tightening cycle in forty years. That record matters, because preferred securities behave very differently in each of those environments.
The mandate is narrow by design, and the operative words in the index name are fixed rate. These are not floating rate or reset preferreds that adjust their coupon when the Fed moves. They are fixed coupon instruments, and 99.60% of the portfolio carries a maturity beyond five years, which in practice means perpetual ([Invesco fact sheet](https://www.invesco.com/content/dam/invesco/us/en/product-documents/etf/fact-sheet/pgx-invesco-preferred-etf-fact-sheet.pdf)). A perpetual fixed coupon security is mathematically a long-duration bond with equity-like subordination. When the discount rate rises, the price falls, and no maturity date pulls it back to par to rescue you.
There is no leverage anywhere in the structure, which distinguishes PGX from the leveraged preferred closed-end funds that got destroyed in 2022 as borrowing costs rose into falling asset values. If rates go against the portfolio, you lose the price move and nothing more, and you keep collecting coupons the whole way down. At 0.51%, the expense ratio is reasonable without being cheap, and what you get for it is a longer record, deeper liquidity, and a portfolio that leans further into investment grade than several alternatives.
Portfolio Composition

Credit quality is better than most buyers assume when they see a 6% handle. The portfolio is 78.41% BBB-rated, 4.40% A-rated, 13.85% BB, and 2.97% B ([Invesco fact sheet](https://www.invesco.com/content/dam/invesco/us/en/product-documents/etf/fact-sheet/pgx-invesco-preferred-etf-fact-sheet.pdf)). Call it 83% investment grade with a 17% sub-investment-grade tail. This is not a junk fund earning its yield through default risk. It is an investment-grade fund earning its yield through subordination and duration, a completely different exposure requiring completely different underwriting.
Sector concentration is the number that should stop you. Financials are 71.15% of the fund, utilities 12.02%, real estate 6.71%, communication services 5.60%. That is not diversified, and it is not an accident. Banks and insurers dominate preferred issuance because regulatory capital rules reward them for it, so any market-weight preferred index is a bank capital fund whether it advertises itself that way or not.
The holdings confirm it. JPMorgan Chase appears across at least five series with coupons from 4.20% to 6.00%, combining to roughly 7% of the fund. Wells Fargo's 4.75% preferred is 1.47%, Bank of America runs about 2.4% across multiple series, and AT&T another 2.4%. The top ten positions total roughly 13.4% of assets, so single-name risk is contained, but sector exposure is not. You are underwriting the American banking system's capital structure, which in 2026 is defensible given strong capital ratios and manageable credit losses. In March 2023, when regional bank preferreds repriced violently over a weekend, it was far less comfortable.
And the two risks are not independent. A rate shock pressures every fixed-rate preferred in the book while simultaneously pressuring the marks on the securities portfolios of the banks that issued them. That correlation is what makes preferred stock a poor diversifier at the worst possible moment.
Performance Analysis


The annual return record maps almost perfectly onto the path of interest rates. PGX returned 17.65% in 2019 as rates fell, 7.12% in 2020, and 3.15% in 2021. Then 2022 arrived and the fund lost 21.15% ([Yahoo Finance](https://finance.yahoo.com/quote/PGX/performance/)). Recovery followed at 9.51% in 2023, 6.53% in 2024, and 3.47% in 2025, and the fund is down 0.90% year to date in 2026.
Sit with the 2022 number, because it is the most important data point here. A portfolio that is 83% investment grade lost more than a fifth of its value in a year with essentially no defaults. That loss was pure duration, and credit quality provided no protection at all because credit was never the risk.
The price chart makes the cumulative damage clearer than annual returns do. Shares changed hands near $15.60 in January 2020 and trade at $10.67 today, roughly a 32% decline in principal over six and a half years ([Total Real Returns](https://totalrealreturns.com/s/PGX)). Total return is far less bad than that, because distributions kept arriving, but an investor who bought in 2020 and spent the income has a materially smaller position today.
The 52-week range of $10.68 to $11.92 tells you where we sit, near the low end, and the year-to-date loss of 0.90% against a 6%+ distribution rate means price has given back the entire income and a bit more ([Morningstar](https://www.morningstar.com/etfs/arcx/pgx/quote)).
Macro Environment
Here is where the position gets interesting rather than merely damaged.
PGX is one of the cleanest expressions of a rate view available to income investors. No leverage muddying transmission, no options overlay capping upside, no discount to fight. If long rates fall, a book of perpetual fixed-rate preferreds rises and you collect 6% while waiting. If they stay put, you collect 6% and price drifts. If they rise, you collect 6% and lose more than that in principal.
The Fed is holding with expectations of cuts later in 2026. If that materializes, PGX benefits directly, and the appeal comes from where the fund already trades. Buying at $10.67 near the bottom of the 52-week range, after six years of erosion, is a far better entry than buying at $15.60 in 2020 with a 5% yield and zero cushion.
What I would not do is treat cuts as a certainty. The front end matters less here than the long end, and the two do not always move together. A Fed that cuts while inflation expectations rise produces a steeper curve and higher long rates, the scenario where PGX gets hurt even as headlines read dovish. Anyone betting on cuts through a long-duration credit instrument is betting on the ten-year, not the funds rate.
Distribution Policy

The distribution here is refreshingly honest and slightly annoying in equal measure.
Honest first. PGX pays monthly, and the distribution is 100% ordinary income with no return of capital ([Invesco](https://www.invesco.com/us/en/financial-products/etfs/invesco-preferred-etf.html)). Every dollar paid out is a dollar the portfolio earned in coupons. No managed payout smoothing over an income shortfall, no NAV erosion from paying more than the assets generate. The price decline here has nothing to do with distribution policy and everything to do with rates, a distinction most high-yield funds cannot make.
The annoying part is variability. Payments run roughly $0.050 to $0.060 per share monthly and move with the income the portfolio collects. Recent months printed $0.0500 in May and June 2026, down from $0.0600 in March and April, and through 2025 payments generally ran $0.051 to $0.056. That is not a cut signaling a coverage problem, it is arithmetic reflecting turnover, calls, and reinvestment at prevailing yields. But a 20% monthly swing is harder to budget around than a fixed rate.
One consequence of pure income distributions is tax treatment. This is ordinary income taxed at your marginal rate, not qualified dividend income, so a 6.31% yield taxed at 37% nets under 4%. PGX belongs in tax-advantaged accounts, and after-tax math should drive the allocation rather than the headline yield.
Advantages
Simplicity is the primary advantage, and I do not say that lightly. Almost every fund I profile has a structural feature that dominates the investment case, usually leverage or a discount or a distribution policy requiring forensic work. PGX has none. You own 265 preferred securities, pay 51 basis points, and collect the coupons.
Second, the credit quality is genuinely good for the yield. Getting 6.31% from a portfolio that is 78% BBB and 83% investment grade overall is not something the corporate bond market offers. The compensation comes from subordination and duration rather than default risk, the right trade for an investor who can tolerate mark-to-market volatility but not permanent credit losses.
Third, the entry point is far better than it has been. Six years of price decay have already occurred, and at $10.67 near the bottom of the 52-week range with a Fed positioned to cut rather than hike, the asymmetry has improved considerably.
Fourth, no leverage means no forced selling. In a dislocation, levered preferred funds face coverage tests and get compelled to sell into weakness. PGX just absorbs the mark and keeps paying.
Disadvantages
Rate sensitivity is the main disadvantage and it is severe. A portfolio that is 99.6% perpetual carries effectively unbounded duration exposure to the long end. The 2022 loss of 21.15% is the demonstration, and nothing in the fund's construction would prevent a repeat. If you do not have a view on long rates, you should not own this, because you will be holding a concentrated bet on a variable you have not thought about.
The 71% financials concentration is the second problem. Any stress in bank capital, from credit losses, deposit flight, or regulatory change, hits this portfolio disproportionately, and that stress correlates with rate shocks rather than offsetting them.
Third, the income does not compensate for the volatility in every environment. A 6.31% yield against a fund that can lose 21% in a year is a thin cushion, and it takes more than three good years of income to recover one bad year of price. Ordinary income tax treatment reduces the real yield further in taxable accounts, and the variable monthly payment complicates planning.
Final Thoughts
PGX is the least complicated fund I have profiled in months, and that clarity cuts both ways. There is no structure to blame if this goes wrong, and none to save you either. It is a clean, liquid, cheap basket of perpetual bank preferreds paying 6.31%, and its price is a function of long-term interest rates.
My read is that the setup is better than at any point since 2021, for the unglamorous reason that most of the damage is already in the price. Buying the same securities at $10.67 with a 6.31% yield after the tightening cycle has run, with the Fed positioned to ease, is defensible in a way that buying at $15.60 with a 5% yield in 2020 was not. Rates fall, price recovers toward its former range, and you earn 6%+ on top.
The bear case deserves equal weight. If long rates stay elevated or move higher, price keeps eroding and 6% does not cover the loss, exactly as 2026 has demonstrated with a negative 0.90% return despite a full income stream. And the 71% bank concentration means a financial-sector event compounds rather than diversifies the rate risk.
So PGX is a legitimate position for investors who explicitly want long duration and are willing to say so. Size it as a rate bet, hold it in a tax-advantaged account, and expect volatility that looks nothing like a bond fund. What I would not do is buy this because the yield looks good next to Treasuries and assume the investment-grade rating implies stability. The credit quality is real. The price stability is not, and 2022 is the only evidence anyone should need.
The Lead-Lag Report is provided by Lead-Lag Publishing, LLC. All opinions and views mentioned in this report constitute our judgments as of the date of writing and are subject to change at any time. Information within this material is not intended to be used as a primary basis for investment decisions and should also not be construed as advice meeting the particular investment needs of any individual investor. Trading signals produced by the Lead-Lag Report are independent of other services provided by Lead-Lag Publishing, LLC or its affiliates, and positioning of accounts under their management may differ. Please remember that investing involves risk, including loss of principal, and past performance may not be indicative of future results. Lead-Lag Publishing, LLC, its members, officers, directors and employees expressly disclaim all liability in respect to actions taken based on any or all of the information on this writing.



